Figures & data
![Figure 1 Daily maximum and minimum temperatures recorded from November 2009 to March 2011. Arrows indicate the threshold of 1000 CU accumulated.](/cms/asset/9c23bba8-9c39-40e9-96fb-d181852a93fd/tnzc_a_894919_f0001_b.jpg)
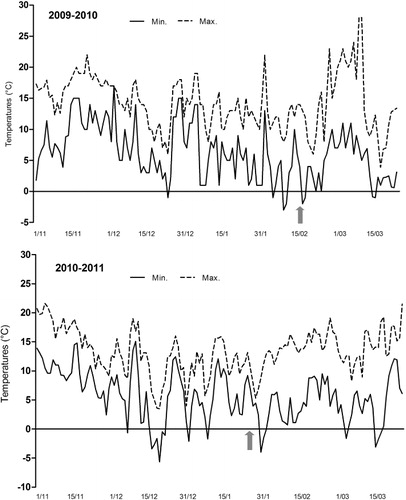
Table 1 Monthly mean maximum and minimum temperatures (°C), relative average (Avg) and cumulative rainfall (mm) from April to June over two growing seasons (2010–11).
![Figure 2 Flowering period (JD = Julian days) and harvest time recorded over two growing seasons (2010–11) in ‘Pisana’ cultivar grafted on to apricot ‘Seedling’ and ‘Myrabolan 29/C’. Harvest = days after harvest date of the reference cultivar ‘San Castrese’ (1 July in central Italy).](/cms/asset/d189f7d2-e7cc-4eef-862e-a32742be87d0/tnzc_a_894919_f0002_b.jpg)
![Figure 3 ‘Pisana’ apricot cultivar grafted on to two rootstocks (‘Myrabolan 29/C’ and apricot ‘Seedling’). Percentage of flowering and fruiting recorded over two growing seasons (2010–11).](/cms/asset/f8c516c3-a6e1-4006-b26e-2b4074649e8d/tnzc_a_894919_f0003_b.jpg)
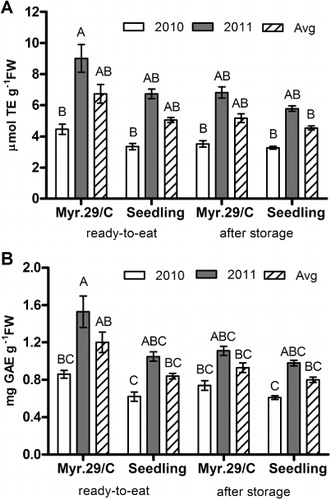
Table 2 Main physical-chemical traits in apricot fruits of ‘Pisana’ cultivar grafted on to ‘Myrabolan 29/C’ and apricot ‘Seedling’ recorded at ready-to-eat stage and after 14 days of 4 °C cold storage. Mean of a 2-year period ± SEM.
![Figure 4 ‘Pisana’ cultivar grafted on to ‘Myrabolan 29/C’ and apricot ‘Seedling’: apricots at ready-to-eat stage and after 14 days of 4 °C cold storage. A, Total antioxidant capacity. B, Total phenols over two growing seasons (2010–11). Means ± SEM. Means with different letters are significantly different (P ≤ 0.01) according to Tukey's test.](/cms/asset/b5499eb5-2b1b-40b0-af45-44f52e484bc4/tnzc_a_894919_f0004_b.jpg)