Figures & data
Table 1. INH Primers for PCR amplification.
Table 2. Primers of peach invertase gene and its inhibitor genes used for real-time fluorescence quantitative PCR.
Table 3. Invertase inhibitor genes and their deduced amino acid in peaches.
Figure 1. Alignment of deduced amino acid sequences of inhibitor genes in peaches. Regions with amino acid identity are marked with different colours. The four conserved cysteine residues are indicated by crosses at the top of the alignment.
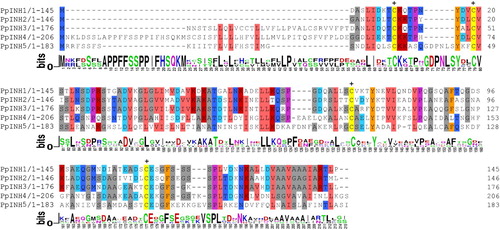
Figure 2. Evolutionary relationship between 18 genes from the PMEI-RP family. The tree was constructed using sequences from 7 different species, including peach. The two main groups are indicated using a dashed line, and the subgroups are identified using Roman numerals. Asterisks (*) indicate invertase inhibitors that have been characterised experimentally. The genes from peach (PpINH1–5) are shown in boxes. The other InvInh gene sequences are cDNAs from potato (StInvInh1, ADM49012; StInvInh2A, ADM49015; StInvInh2B, ADM49016; StInvInh3, ADM49013), tobacco (NtInvInh1, CAA73333; NtInvInh2, CAA73334), tomato (SlInvInh1, CAA09420), Arabidopsis thaliana (AtInvInh1, NP_564516; AtInvInh2, NP_201267; AtPMEI1, NP_175236; AtPMEI2, NP_188348), Zea mays (ZmINH1, ATT24363), and Kiwi (AdPMEI1, BAC54964).
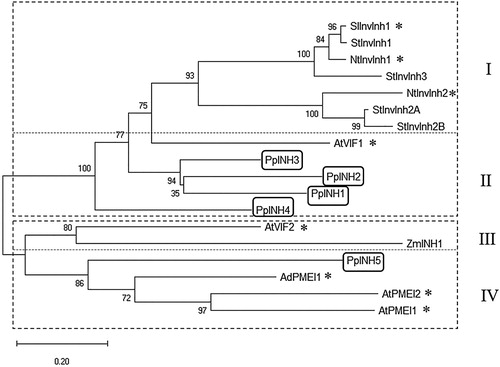
Figure 3. Relative expression of INH genes in peach fruit (‘Yulu’) stored at four different temperatures. (A: 0°C, B: 5°C, C: 10°C, D: 20°C). Values are the means ± SE of triplicate assays. Different letters indicate a significant difference (P < 0.05) between 0°C, 5°C, and 10°C using Duncan's multiple range test at each time point.
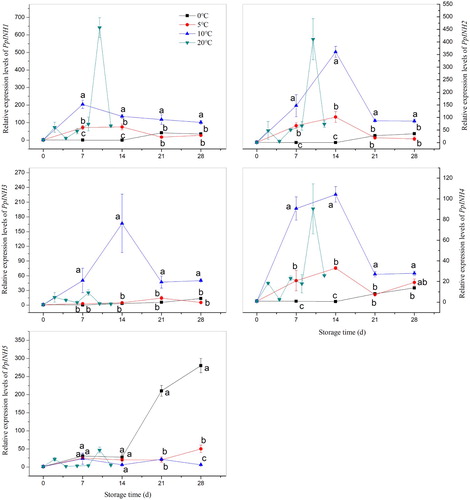
Figure 4. Relative expression of INH genes in peach fruit (‘Yulu’ and ‘Hujingmilu’) stored at 5°C. (A: PpINH1, B: PpINH2, C: PpINH3, D: PpINH4, E: PpINH5). Values are the means ± SE of triplicate assays. Different letters indicate a significant difference (P < 0.05) using Duncan's multiple range test.
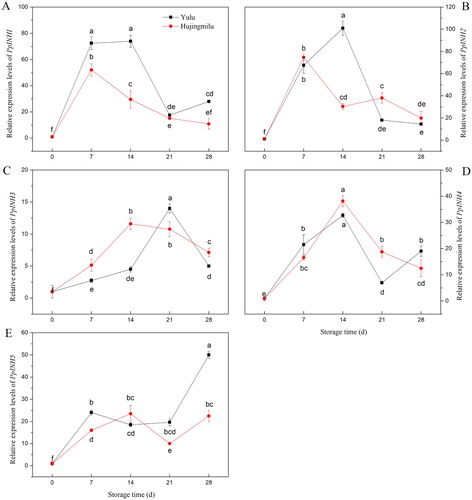
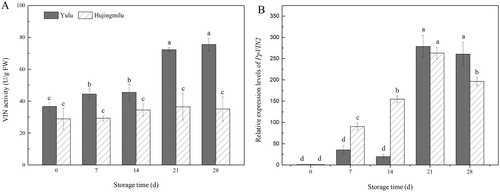
Figure 5. VIN activities and PpVIN2 expression in peach fruit (‘Yulu’ and ‘Hujingmilu’) stored at 5°C. Values are the means ± SE of triplicate assays. Different letters indicate a significant difference (P < 0.05) using Duncan's multiple range test.