
Figures & data
Table 1. Differences in related work.
Figure 1. Conducting the review in the SLR process.
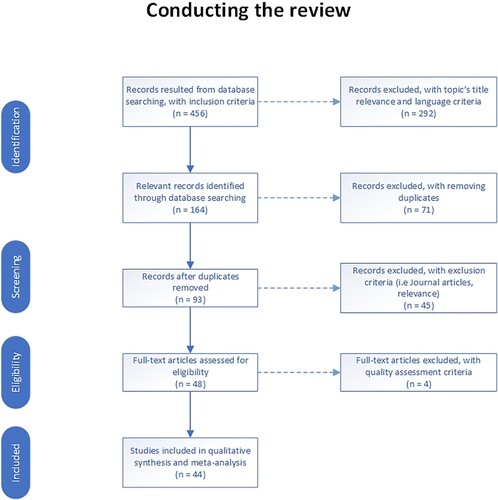
Figure 2. Quality score distribution of the selected studies. (a): Box plot with quantiles, median, and mean values. (b): Histogram with density, median, and mean values.
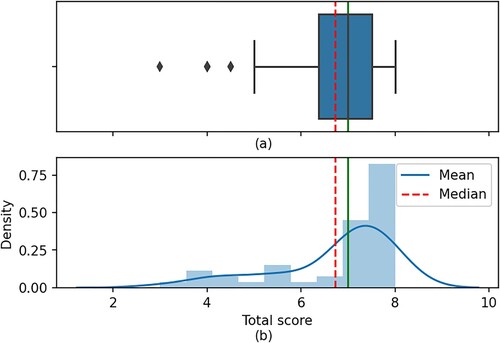
Figure 3. The year-wise distribution of papers.
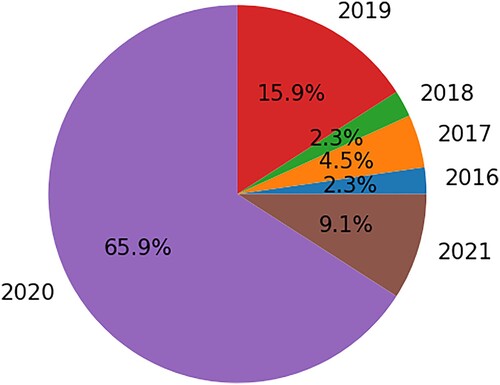
Figure 4. The distribution of papers per publisher.
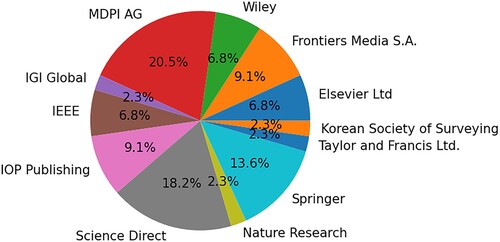
Table 2. Top-5 values of keywords occurrence.
Figure 5. The distribution of papers per key motivation.
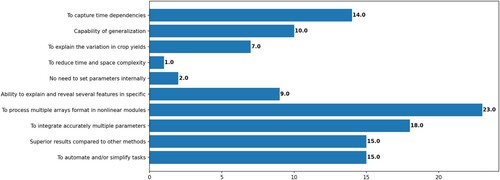
Table 3. Top-5 values of occurrence for key motivation.
Figure 6. The trend of the top-3 values for the key motivation behind applying deep learning.
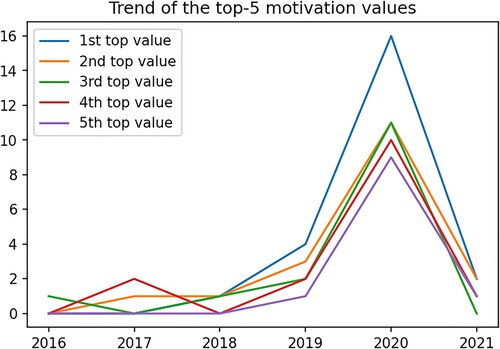
Figure 7. The distribution of papers per crop.
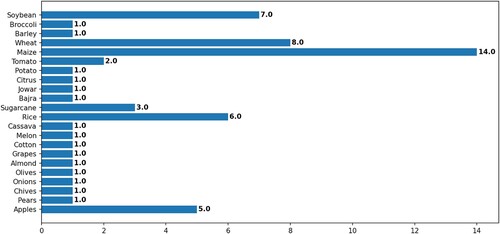
Table 4. Top-5 values of occurrence for crops.
Figure 8. The trend of the top-5 crop values for applying deep learning in crop yield estimation.
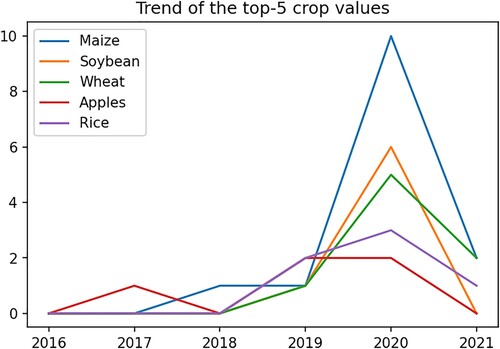
Table 5. Top-5 values of occurrence for data features.
Figure 9. The distribution of papers per group of data features.
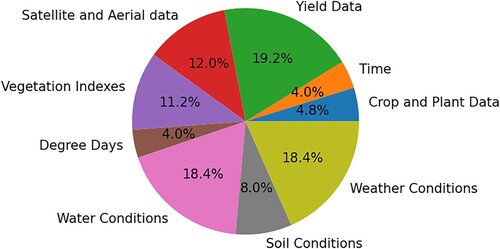
Table 6. Values of occurrence for data features groups.
Table 7. Values of occurrence for datasets.
Figure 10. The distribution of papers per implementation framework.
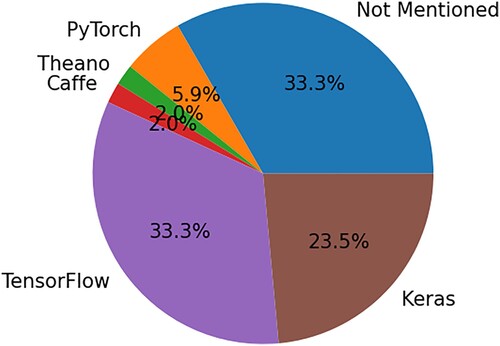
Table 8. Values of occurrence for all implementation frameworks.
Figure 11. The distribution of papers per category.
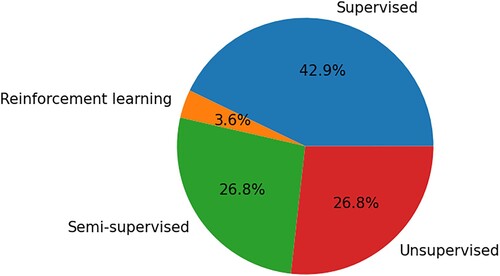
Table 9. Values of occurrence for all categories.
Figure 12. The trend of the category values in estimating crop yield with deep learning.
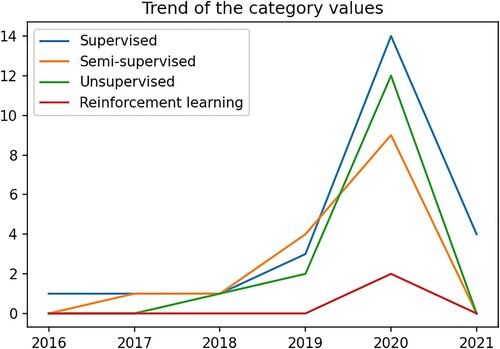
Figure 13. The distribution of papers per algorithm.
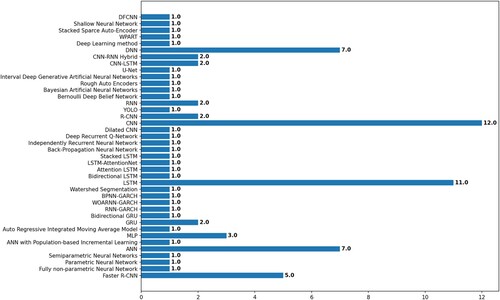
Table 10. Top-5 values of occurrence for algorithms.
Figure 14. The distribution of papers per algorithm’s performance.
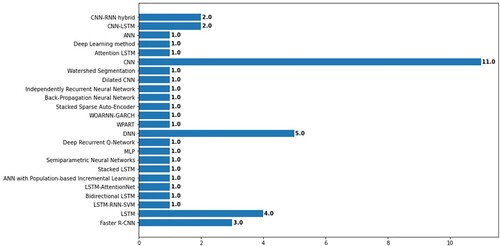
Table 11. Values of occurrence for algorithms’ performance.
Figure 15. The trend of the top-3 values of best performing algorithm crop yield estimation.
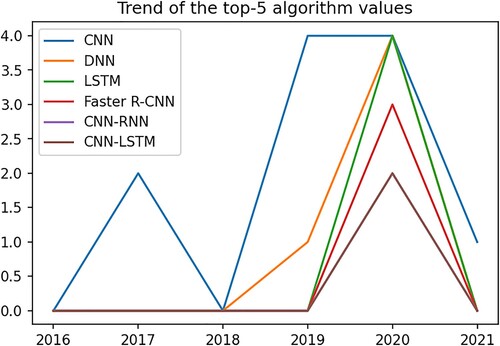
Figure 16. The distribution of papers per evaluation approach.
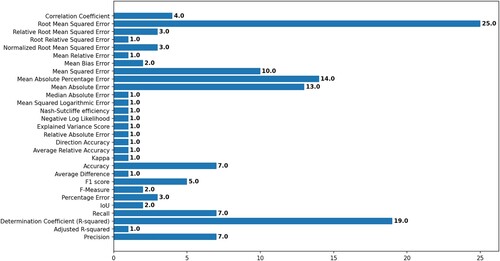
Table 12. Values of occurrence for evaluation approaches.
Table 13. Values of occurrence for challenges and proposed solutions reported in primary studies.