
Figures & data
Table 1. Rootstocks.
Table 2. Experimental orchards.
Figure 1. Effect of rootstocks on avocado yearly yield (A), fruit weight (B), and alternate bearing index (ABI) (C) at Afek experimental site during six consecutive growing seasons. ‘Hass’ scions were grafted on eight different rootstocks and planted in the Afek orchard in 2009 at a density of 800 trees ha−1. Data were collected during six consecutive growing seasons, from 2013–2014–2018–2019. A, Yield values are means ± SE of four repeats (n = 4), at least 11 trees in each repeat. B, Fruit weight values are means ± SE of eight different trees for each rootstock (n = 8). C, ABI values were calculated for each pair of consecutive growing seasons: seasons 1–2 (2013–2014 and 2014–2015), 2–3 (2014–2015 and 2015–2016), 3–4 (2015–2016 and 2016–2017), 4–5 (2016–2017 and 2017–2018) and 5–6 (2017–2018 and 2018–2019). Values are means ± SE of four repeats (n = 4) in each year, at least 11 trees in each repeat. Columns marked with different letters differ significantly by Tukey–HSD, p < 0.05.
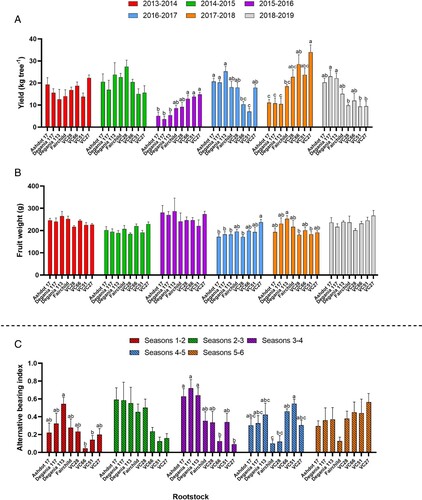
Figure 2. Effect of rootstocks on avocado multiyear (over 6 years) mean yields (A) and alternate bearing index (ABI) (B) at Afek experimental site. A, Yield values are means ± SE of six (n = 6) consecutive yearly yields. B, ABI values are means ± SE of five (n = 5) consecutive biennial ABI values. Dashed line indicates the multiyear average ABI value of all rootstocks.
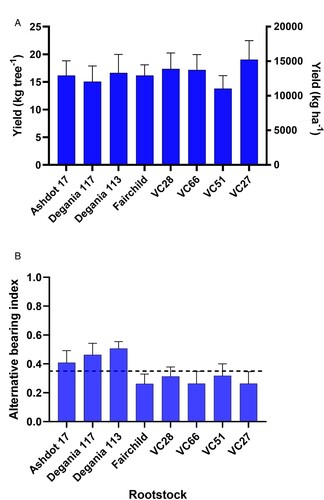
Figure 3. Effect of rootstocks on avocado yearly yield (A), fruit weight (B), and alternate bearing index (ABI) (C) at Gesher Haziv experimental site during six consecutive growing seasons. ‘Hass’ scions were grafted on eight different rootstocks and planted in the Gesher Haziv orchard in 2009 at a density of 420 trees ha−1. Data were collected during six consecutive growing seasons, from 2013–2014–2018–2019. A, Yield values are means ± SE of four repeats (n = 4), at least 15 trees in each repeat. B, Fruit weight values are means ± SE of eight different trees for each rootstock (n = 8). C, ABI values were calculated for each pair of consecutive growing seasons: seasons 1–2 (2013–2014 and 2014–2015), 2–3 (2014–2015 and 2015–2016), 3–4 (2015–2016 and 2016–2017), 4–5 (2016–2017 and 2017–2018) and 5–6 (2017–2018 and 2018–2019). Values are means ± SE of four repeats (n = 4) in each year, at least 15 trees in each repeat. Columns marked with different letters differ significantly by Tukey-HSD, p < 0.05.
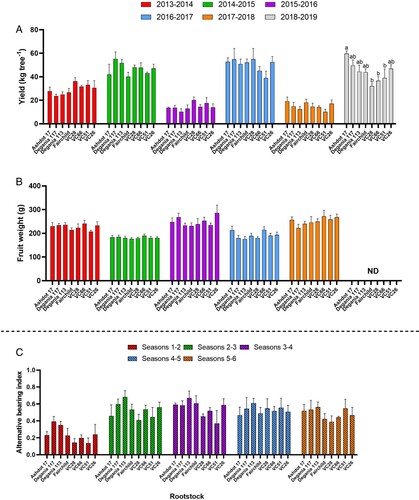
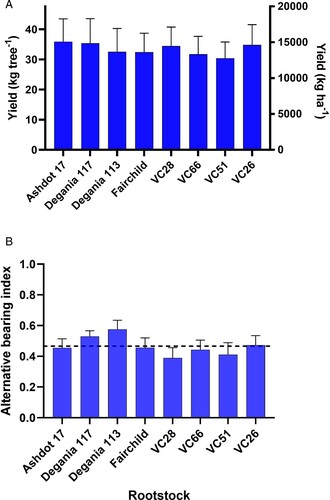
Figure 4. Effect of rootstocks on avocado multiyear (over 6 years) mean yields (A) and alternate bearing index (ABI) (B) at Gesher Haziv experimental site. A, Yield values are means ± SE of six (n = 6) consecutive yearly yields. B, ABI values are means ± SE of five (n = 5) consecutive biennial ABI values. Dashed line indicates the multiyear average ABI value of all rootstocks.