Figures & data
Table 1. Initial quality of ‘Hayward’ kiwifruit from three orchards.
Figure 4. Symptoms of disorders on ‘Hayward’ kiwifruit. A, B: chilling injury (CI). C, D: white core inclusion (WCI). E: WCI dyed with potassium iodide solution in the transection of kiwifruit core tissue. The image scale is indicated by the kiwifruit seeds. The arrows point to starch clusters dyed in black. F: Healthy fruit.
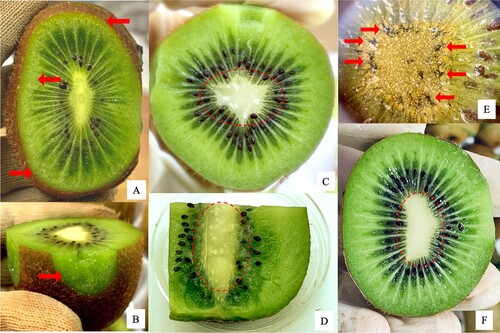
Figure 1. Firmness of ‘Hayward’ kiwifruit stored in CA (2% O2 + 5% CO2) and air at 0°C 95% RH with additional ethylene at the concentration of 0, 10, 100 and 1000 nL·L−1 from Week 3 to Week 13. Each data point represents a mean of 3 replicates. Error bars represent LSD0.05. The dash line indicates the 10 N threshold.
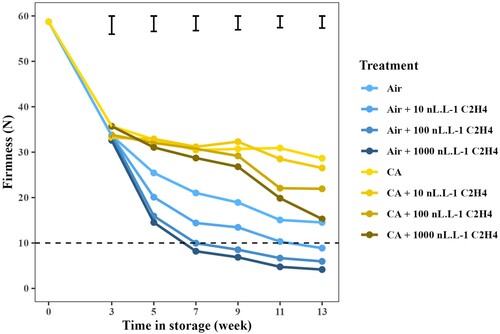
Figure 2. Firmness distribution of ‘Hayward’ kiwifruit in responses to ethylene at the concentration of 0, 10, 100 and 1000 nL·L−1, in CA (2% O2 + 5% CO2) and air storage at 0°C. n = 90. Values share a same letter are not significant different at P < 0.05 within the same treatment. The dash line indicates the 10 N threshold.
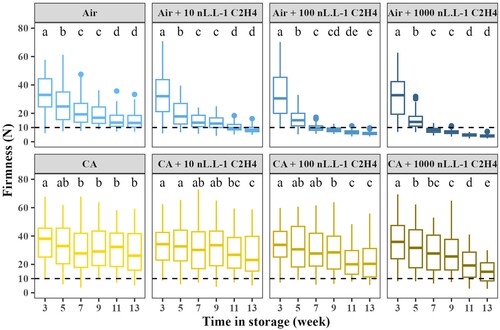
Figure 3. Soluble solids content (SSC) of ‘Hayward’ kiwifruit stored in CA (2% O2 + 5% CO2) and air at 0°C 95% RH with additional ethylene at the concentration of 0, 10, 100 and 1000 nL·L−1 from Week 3 to Week 13. Each data point represents mean of 3 replicates. Error bars represent LSD0.05.
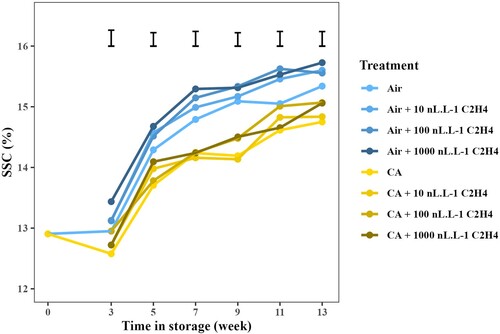
Figure 5. Incidence of white core inclusions (WCI) in ‘Hayward’ kiwifruit stored in air and CA (2% O2 + 5% CO2) storage with ethylene at the concentration of 0, 10, 100 and 1000 nL·L−1 at 0°C 95% RH. Each bar represents mean ± standard error of mean, n = 3. WCI was observed only in CA with 100 and 1000 nL·L−1 ethylene, and was not observed before Week 11.
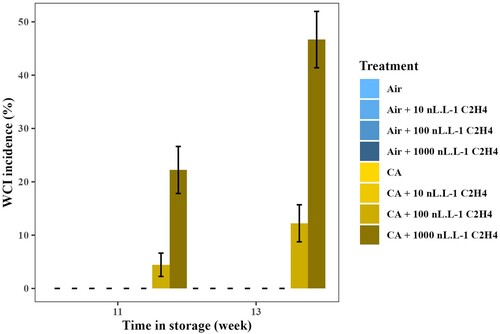
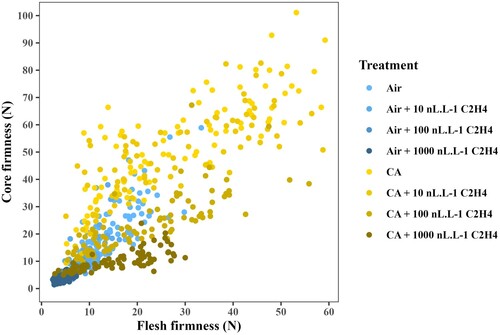
Figure 6. Correlation between core firmness and flesh firmness of ‘Hayward’ kiwifruit after 13 weeks of storage in air and CA (2% O2 + 5% CO2) with ethylene at the concentration of 0, 10, 100 and 1000 nL·L−1 at 0°C. Each data point represents a fruit.