Figures & data
Fig. 1 A schematic diagram of the experimental unit for treatment 4L1FR showing the girdles at the base of the shoot. Initially the shoot has been pruned to length so that seven leaves and two fruits remained, and girdled to phloem isolate the experimental unit. About 20 days later, this was reduced to four leaves and one fruit. The initial pruning stimulated development of a vegetative regrowth and this was retained. Leaves were continually removed from the regrowth before they were fully expanded. In this way the regrowth acted as a net sink.
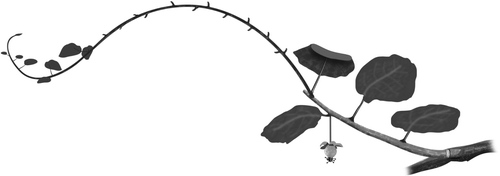
Table 1 Year 1. Effect of leaf number (L) and regrowth (R) on fruit growth, measured as fresh weight (FW), dry weight (DW) and dry matter content (DM), and on seed production, with standard errors in parenthesis. Means within a column are different at α = 0.05, except for seed numbers which are not different at this level. Each treatment shoot contained one fruit (1F)
Fig. 2 Time sequence of fruit and vegetative growth for treatments with varying numbers of leaves (L) and fruit (F) in year 1. (A) Estimated fruit fresh weights (FW) based upon LDD. Lines with data points and standard errors show the fruit FW, while the smooth lines alone are the corresponding growth rates calculated using cubic spline fitting to the size data using the R statistical language. (B) Measured regrowth lengths.
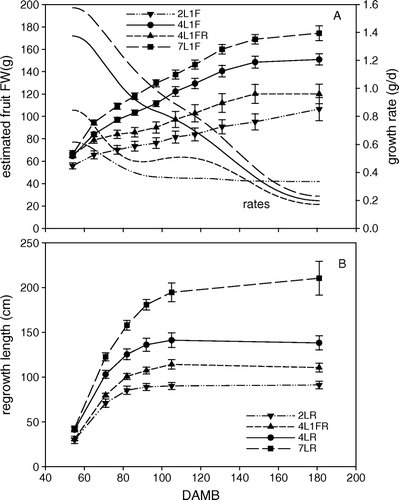
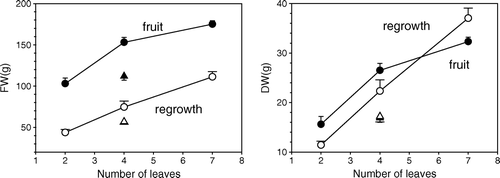
Fig. 3 Effect of leaf number on fresh weight (FW) and dry weight (DW) at 181 DAMB of a single type of sink (fruit = filled symbols, regrowth = hollow symbols). The single data point for four leaves when there was also a sink of the other type competing for resources is shown as a triangle. Error bars show the standard error.