Figures & data
Table 1. Variables, operationalisation and measurement.
Figure 1. Proportion of business interests per political system.
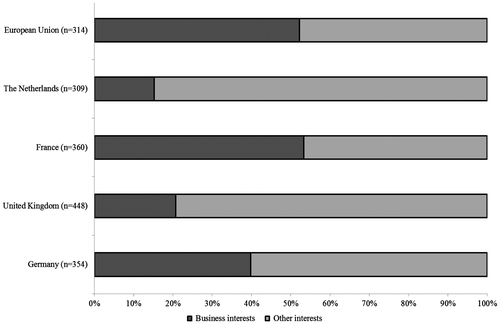
Table 2. OLS regression on the proportion of business interest associations per policy domain, n = 90 policy domains in four countries.
Figure 2. Organisational orientation per political system: frequency distributions of scores on policy interest.
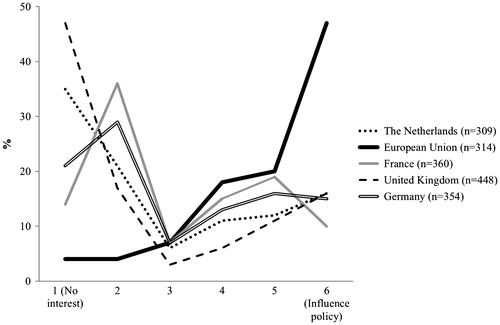
Figure 3. Organisational orientation per political system: frequency distributions of scores on membership involvement.
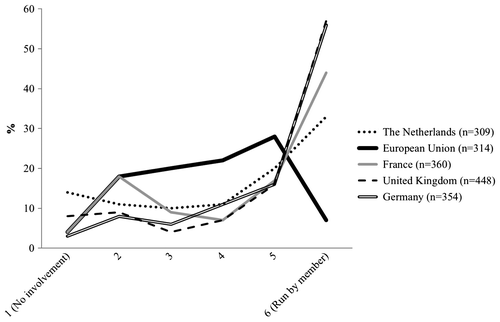
Table 3. OLS and logistic regression on the policy interest, membership involvement and combined policy/membership scores (logistic regression on indicator when both scores are greater than 4: ‘Representative capacity’).
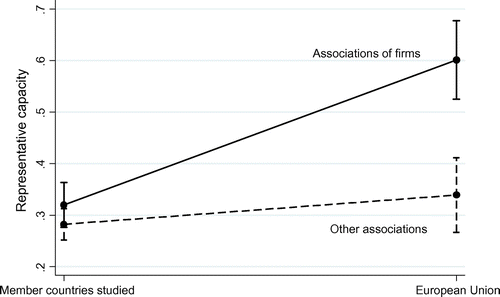
Figure 4. Predicted probabilities of the representative capacity of business interest associations versus other associations in the EU and four member states, adapted version of Model 3(9) from Table .