
Figures & data
Figure 1. Conceptual model.
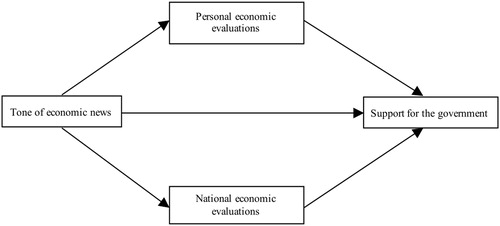
Table 1. Media data per outlet per wave.
Table 2. Explaining economic evaluations.
Table 3. Explaining government support.
Table 4. Descriptive statistics per condition.
Figure 2. SEM Model.
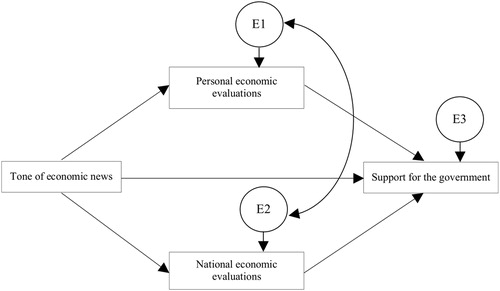
Table 5. Maximum likelihood estimates.
Table 6. Indirect effects of economic news (tone) on government support.