
Figures & data
Table 1. Case selection for the survey experiment.
Figure 1. Average Treatment Effect of experts’ endorsements on support for COVID-19 measures. Note: both countries (black), UK (dark grey) and Germany (light grey), whiskers are 95% confidence intervals.
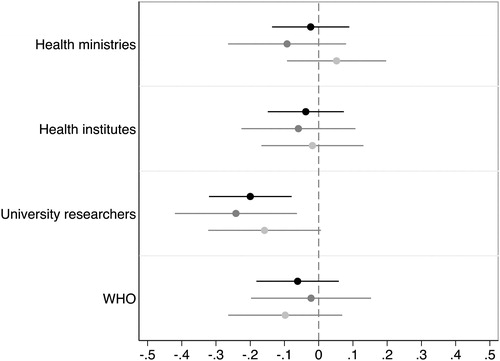
Table 2. Interaction between expertise and treatment (H2), both countries.
Figure 2. Adjusted predictions based on Model 4 focussing on the World Health Organisation. Note: whiskers are 95% confidence intervals, visualisation based on package written by Helmdag (Citation2018).
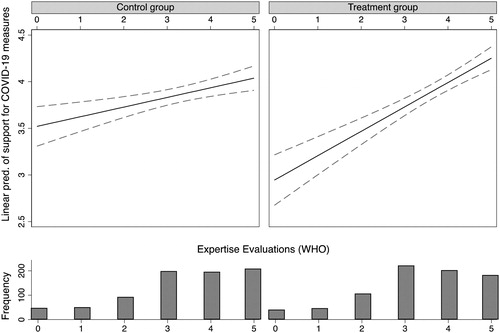
Table 3. Interaction between expertise and treatment (H2).
Table 4. Interaction between neutrality and treatment (H3), both countries.
Table 5. Interaction between exposure and treatment (H4), both countries.
Supplemental material