
Figures & data
Figure 1. Share of female councillors and mayors (1945–2019) (%), Denmark and Norway.
Source: Norway: Statistics Norway Statbank table 09494 and Berglund (Citation2005); Denmark: Statistics Denmark, Statistiske Efterretninger, various years, and Kjaer and Opstrup (Citation2018).
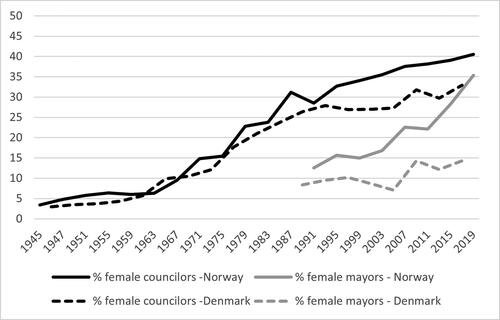
Table 1. Per cent women amongst elected councillors, by municipal size (population), Denmark 2017 and Norway 2019.
Table 2. Per cent women amongst elected candidates, by party, Denmark 2017 and Norway 2019.
Table 3. Per cent women amongst elected candidates, by ballot structure, Denmark 2017 and Norway 2019.
Table 4. Per cent women amongst elected candidates, by party and ballot structure, Denmark 2017 and Norway 2019.
Figure 2. Per cent who agreed or disagreed that different types of representation are important, Denmark 2017 and Norway 2019.
Notes: Questions asked: ‘It is important that the municipal politicians come from different geographical parts of the municipality; It is important that the age distribution in the municipal council is roughly the same as among the voters; It is important that the distribution of men and women among the local politicians is similar to the distribution among the voters.
Minimum N: Denmark = 5100, Norway = 3703.
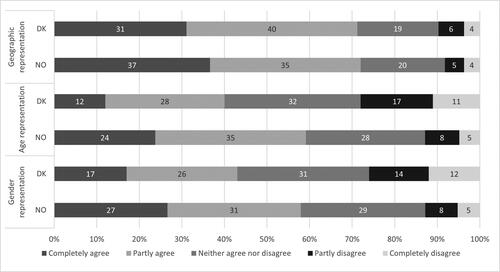
Table 5. Per cent who totally or partly agreed that different types of representation are important, by gender, Denmark 2017 and Norway 2019.
Figure 3. Per cent who stated that a reason was of great importance/played a large role for the preferential vote, Denmark 2017 and Norway 2019.
Notes: Questions asked: Denmark: ‘How important were the following reasons when you chose to vote for this specific candidate? No importance; Some importance; Great importance; Don’t know’. Norway: ‘There may be many reasons for casting preferential votes. What role did the following reasons play for your preferential vote at the municipal election? Played a large role; Played some role; Played no role’.
Minimum N: Denmark = 3275, Norway = 1567.
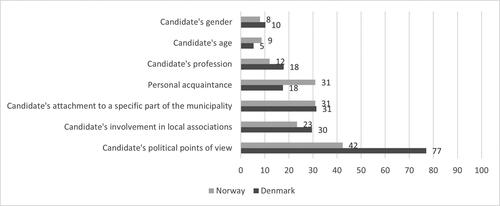
Table 6. Per cent who stated that a reason was of great importance/played a large role for the preferential vote, by gender, Denmark 2017 and Norway 2019.
Data availability statement
The Norwegian data sets are available at Statistics Norway and Sikt – Norwegian Agency for Shared Services in Education and Research. The Danish data sets are available at Statistics Denmark and the Danish National Archives.