Figures & data
Figure 1. Actors in German anti-containment protests in 2020.
Note: The protest event data of the MOTRA project is based on the manual coding of two German quality newspapers (Die Welt and Süddeutsche Zeitung).
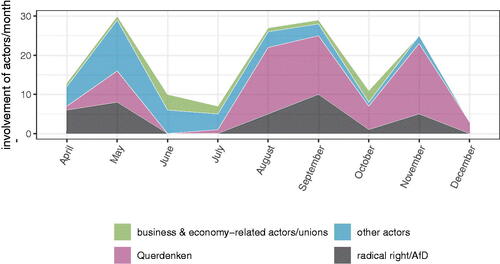
Figure 2. Development of sympathy and readiness to participate in anti-containment protests by survey wave (2020–2021).
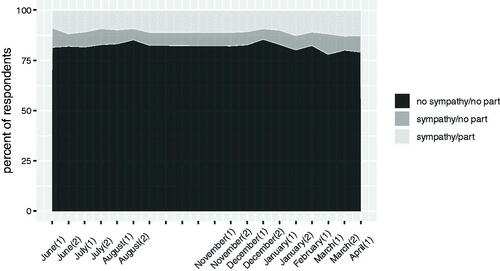
Figure 3. Share of groups by respondents’ attitude.
Note: Left–right self-placement is measured on an 11-point scale from 0, left, to 10, right. Trust in government also ranges from 0, do not trust at all, to 10, trust completely. Worries about individual and political freedoms are composite measures (see online appendix sections 1 and 2). They range from 1 to 5, lower values indicating less concern. Note that the graphs in the first column present the share of participants who show sympathy for the protests by these political attitudes. The graphs in the second column focus on the shares of ‘sympathisers’ and their (non-)willingness to participate in the demonstrations.
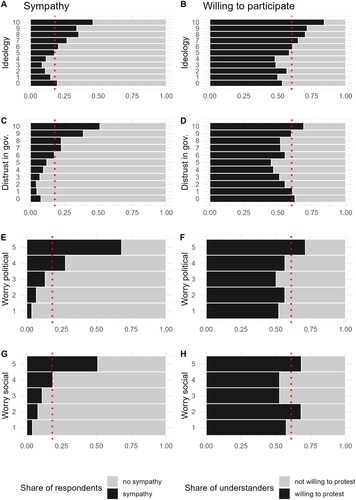
Figure 4. Average marginal effects of logistic regression models predicting sympathy for and willingness to participate in anti-containment protests.
Note: The full regression models with all control variables can be found in the online appendix section 5. The coefficients come from models excluding (models 1 and 2) and including (models 3 and 4) ‘worries about freedom restrictions’, which have only been asked from August 2020 onwards. A coefficient depicted in corresponds to the association between a change in an independent variable and a change in the dependent variable. Please also note that the models with willingness to participate as DV include sympathy as an additional IV.
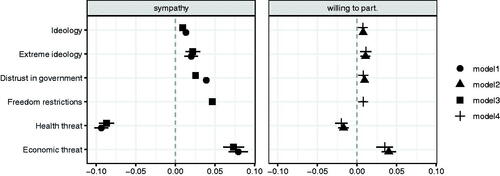
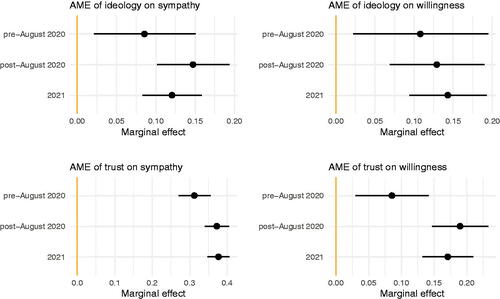
Figure 5. Average marginal effects of left–right ideology and trust in government conditional on time.
Note: shows the average marginal effects for two variables – ideological self-placement and distrust in the government. Interacting the variables with different time periods allows for assessing how much their effect on protest sympathy and willingness to participate changes over time. The regression models include all our standard independent variables, expect for freedom restrictions, which were only asked from wave 14 onwards.