
Figures & data
Figure 1. Flow chart of study selection.
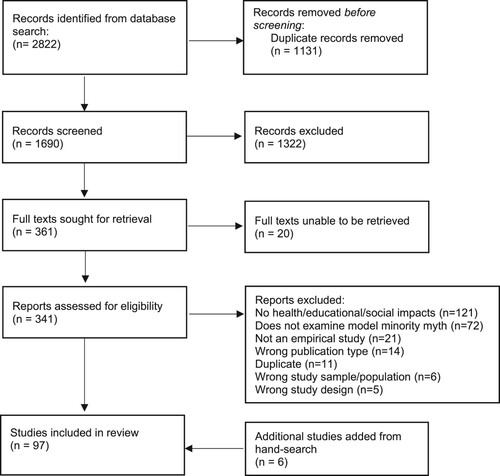
Figure 2. Number of publications on the model minority and its impacts from 1995 to 2020a. aUp to 6 August 2020.
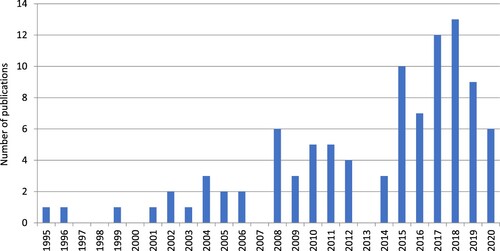
Table 1. Summary of included studies (n = 97).
Supplemental material
Figure 1. Flow chart of study selection.
Figure 2. Number of publications on the model minority and its impacts from 1995 to 2020a. aUp to 6 August 2020.
Table 1. Summary of included studies (n = 97).