Figures & data
Figure 1. Histogram of Anti-Black Implicit Bias with Normal Curve Overlay (N = 1,868).
Note on IAT D scores: These scores are bounded within the range from −2 to 2. The break points for “slight” (+/−0.15), “moderate” (+/−0.35), and “strong” (+/−0.65) implicit bias are standard. I interpret D scores between −0.15 and 0.15 as negligible.
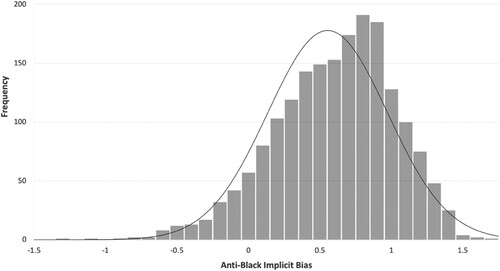
Table 1. Descriptive Statistics (N = 1,868).
Table 2. Anti-Black implicit bias by friendships with African Americans (N = 1,868).
Table 3. Friendships with African Americans and Anti-Black Implicit Bias by Political Party Affiliation (N = 1,868).
Table 4. OLS regression models predicting anti-Black implicit bias using friendships with African Americans and political party affiliation (N = 1,868).
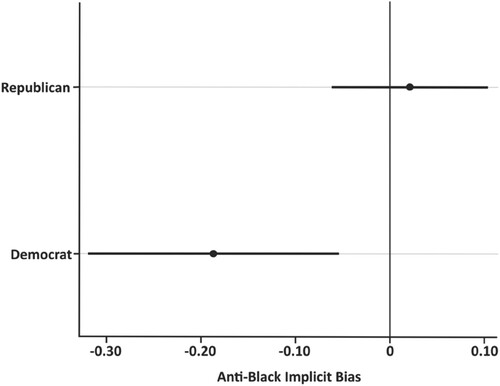
Figure 2. Marginal Effect of Friendships with African Americans on Anti-Black Implicit Bias (N = 1,868).
Note: This figure displays 95 per cent confidence intervals.