
Figures & data
Table 1. Survey questions used for evaluation and participation assent.
Table 2. Criteria for forming assenting and dissenting groups.
Figure 1. Distribution of answers to the diversity assent items. Note: N = 2800, missings (don’t know or refuse to answer) per question shown in table A2B in the online appendix. Weights are applied.
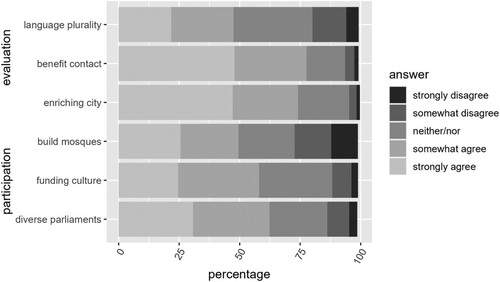
Figure 2. Evaluation and participation assent and dissent among survey respondents. Note: N = 2893. Weights are applied.
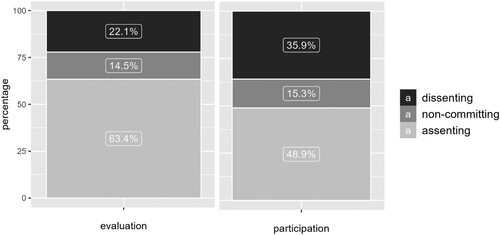
Figure 3. Groups of Diversity Assenters. Note: N = 2893, Weights are applied.
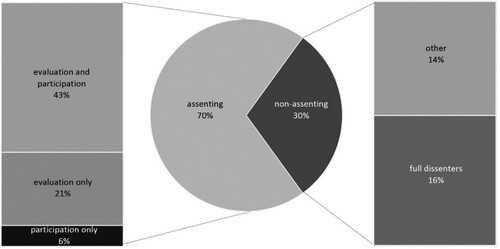
Figure 4. Frequency of assenters and non-assenters across different groups. Note: Missings for each variable are reported in table A2a in the online appendix, weights are applied.
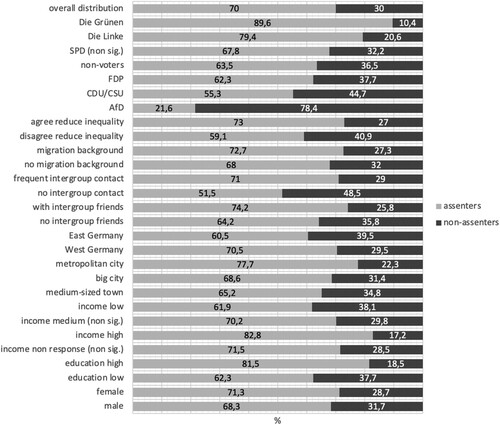
Figure 5. Results of logistic regression, assenters vs non-assenters. Note. N = 2723. Plotted are average marginal effects calculated from logistic regression shown in online appendix table A3. Ref. categories for categorical variable, voting (SPD), cities (large town), income (low income).
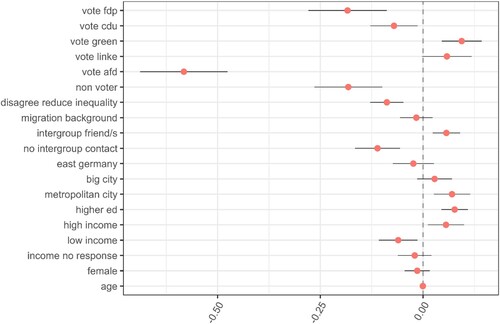
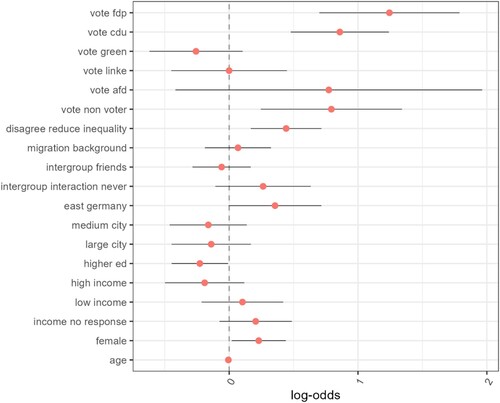
Figure 6. Results of multinomial regression model, “evaluation only” assenters. Note: N = 2723. Plotted are log-odds for belonging to the groups “evaluation only” assenters in comparison with evaluation and participation assenters, calculated from model 1 in table A5.
Supplemental Material
Download MS Word (237 KB)Data availability
The DivA dataset is currently in the GESIS online repository, and will be released from an embargo period on 31.12.2024. For access or other enquiries, please contact Karen Schönwälder at schönwä[email protected]