Figures & data
Figure 1. A general model to explain informal caregiving. Note: Own graph, based on Broese van Groenou and De Boer (Citation2016).
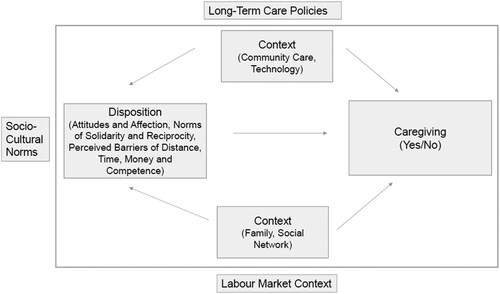
Figure 2. A model to explain caregiving by migrants. Note: Own graph, based on Willis (Citation2012).
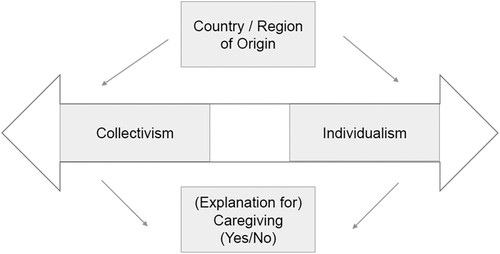
Figure 3. A model for care use. Note: Own graph, based on Hansen (Citation2014).
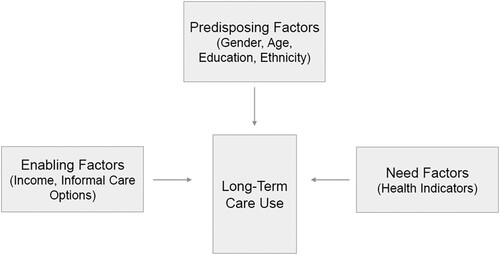
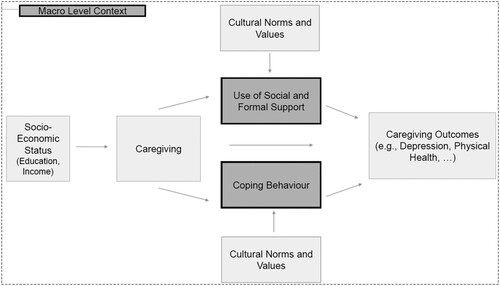
Figure 4. A model for health outcomes of caregiving. Note: Own graph, based on Pearlin et al. (Citation1990).
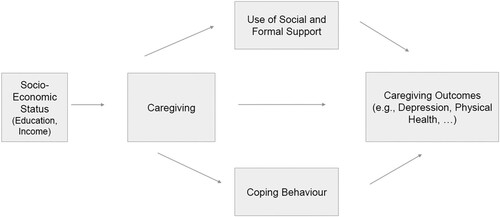
Figure 5. A model for health outcomes of caregiving by migrants. Note: Own graph, based on Knight and Sayegh (Citation2010).
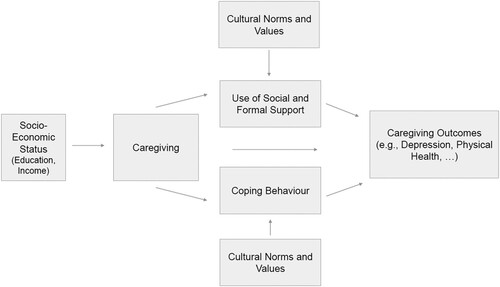
Figure 6. Caregiving during the pandemic. Note: Own graph suggests that the pandemic affected the dark marked areas in particular, based on Knight and Sayegh (Citation2010).