Figures & data
Table 1. Descriptive statistics.
Table 2. Linear regression analysis on perceived political representation of migrants.
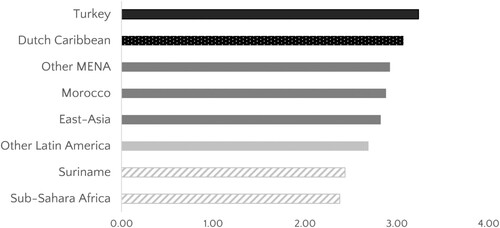
Figure 1. Predicted perceived political representation by migration background.
Note: predicted perceived political representation based on Model 2 of , estimated for primary or secondary education, men, non-religious, first-generation and mean age. We distinguish four groups from top to bottom: (1) Turkey significantly differs (with at least p < 0.1) from Other MENA, Morocco, East-Asia, Other Latin America, Suriname and Sub-Sahara Africa; (2) Dutch Caribbean significantly differ from Suriname and Sub-Sahara Africa; (3) Other MENA, Morocco and East-Asia significantly differs from Turkey, Suriname and Sub-Sahara Africa; (4) Other Latin America significantly differs from Turkey; (5) Suriname and Sub-Sahara Africa significantly differ from all other migration backgrounds, except Other Latin America.