
Figures & data
Figure 1. Boxplot number of Mini-CEXs from supervisor and peer comparing low, average, and high performing students. The y-axis reflects the number of Mini-CEXs collected compared to the minimum requirements as recorded in the exam regulations. Regarding Mini-CEXs from supervisor, the median value in low, average, and high performing students is 4, 6, and 7, respectively. For example, a median value of four represents students collecting four more Mini-CEXs than minimally required. Regarding Mini-CEXs from peer, the median value in low, average, and high performing students is 1, 2, and 2, respectively.
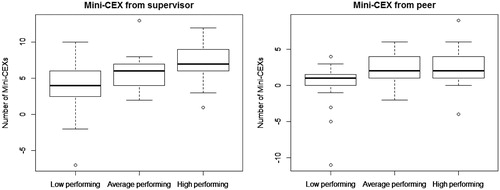
Table 1. Mean and SD values of the orientation of motivation compared between low, average, and high performing students on a 1- to 5-point Likert scale.
Table 2. p Values post-hoc Dunn’s test with Holm correction. The (sub)scales autonomous motivation, intrinsic motivation, identified regulation, and external regulation were compared between low, average, and high performing students.