
Figures & data
Table 1. Description of clinical education wards (CEWs) and patients.
Figure 1. Problem frequency in patients perceptions on treatment success, overall quality of care, and recommendation of hospital to others – comparing clinical education wards (CEW) with control groups (CG1 and CG2) using Mann-Whitney-U-test.
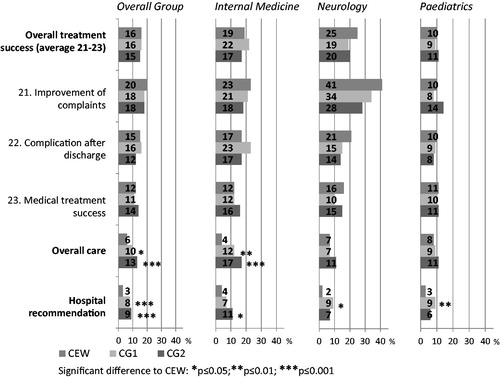
Figure 2. Problem frequency from patients’ or their parents’ (pediatrics) points of view on physician/student patient interaction (PPI) – comparing clinical education wards (CEW) with control groups (CG1 and CG2) using Mann-Whitney-U-test.
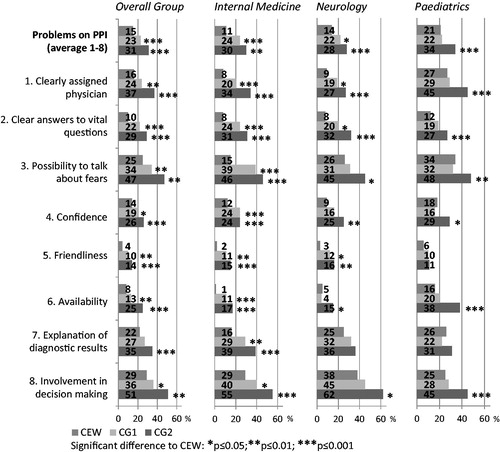
Figure 3. Patients’ perceptions on active student participation in patient care.
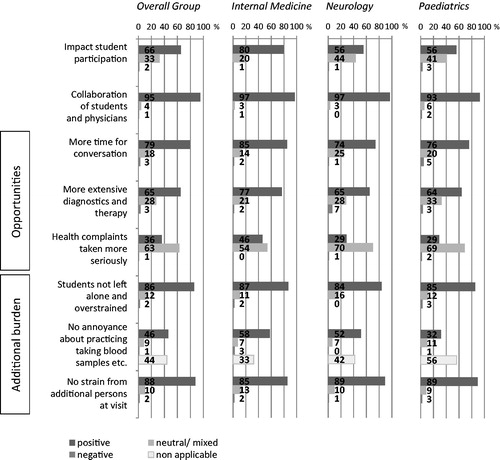
Table 2. Spearman rank correlation (rS).
Table 3. Qualitative analysis of free-text responses.