
Figures & data
Figure 1. A bar graph showing Examiner 1’s scores given to each of the students in a station (Wong et al. Citation2020).
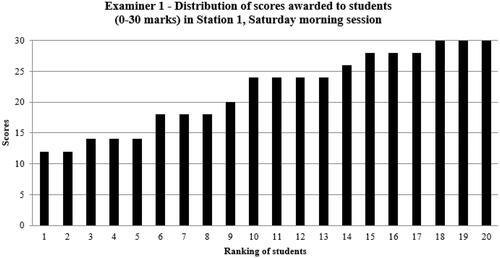
Figure 2. Boxplots comparing an examiner’s score with the other examiners in the same station (Wong et al. Citation2020).
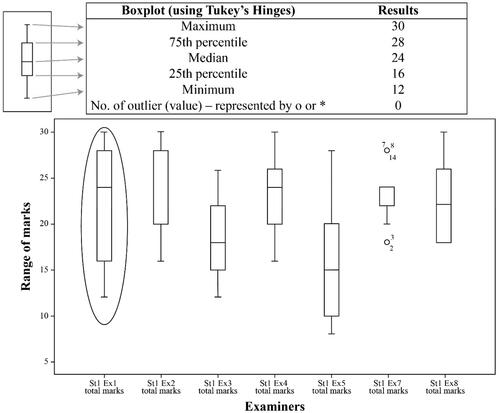
Figure 3. A bar graph comparing an examiner’s mean percentage score given to students with the entire cohort of examiners (Wong et al. Citation2020).
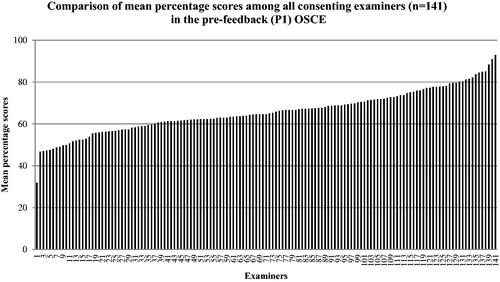
Table 1. Two themes and the associated enablers and barriers that influenced the effectiveness of structured feedback.