
Figures & data
Figure 1. Charter schools under analysis in Bogota.
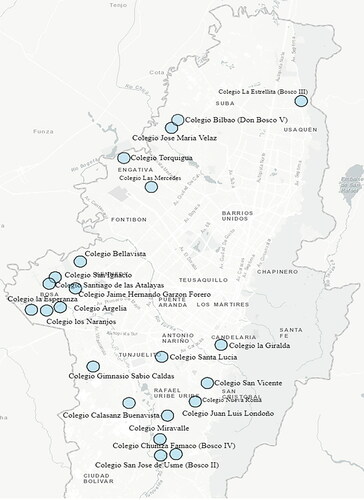
Table 1. Complete data set per type of school.
Table 2. Summary of statistics per schools observed.
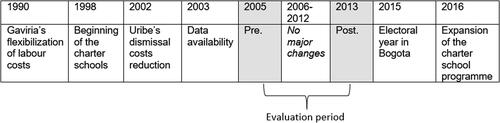
Figure 2. Timeline of charter schools’ introduction and other labour reforms in Colombia.
Graph 1. Yearly average evolution of teacher’s monthly average salary per type of school in pounds.
Graph 2. Yearly average evolution of general workload (teaching units) per school and type of school.
Graph 3. Yearly average evolution of individual teacher’s ratio of workload (teaching units) per school and type of school.
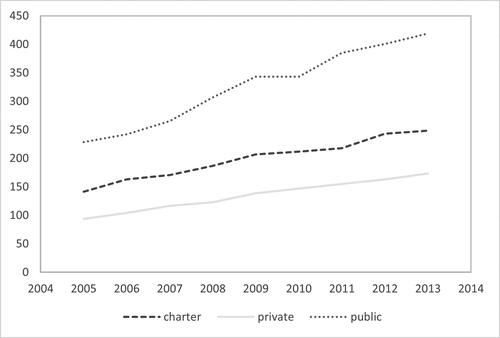
Table 3. Difference-in-Differences outcomes with different estimation techniques for Y = log of teacher’s salary.
Table 4. Difference-in-Differences outcomes with different estimation techniques for LW = ratio of teaching workload.
Table 5. Balancing test: DID with covariates vs Propensity Score Matches with Kernel DID – model 4 vs model 3.
Table 6. Balancing test: DID with covariates vs Propensity Score Matches with Kernel DID – model 8 vs model 7.