
Figures & data
Figure 1. Types of leader as a percentage of all teachers (2002-03 to 2018-19).
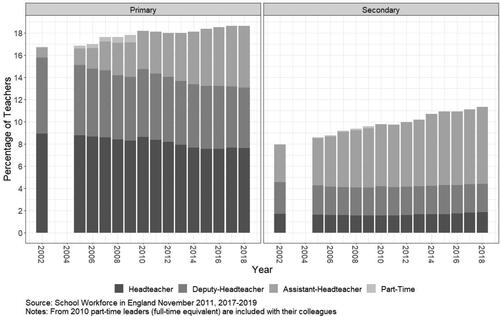
Figure 2. Percentage of full-time, qualified classroom teachers receiving managerial payments (2010-11 to 2014-15).
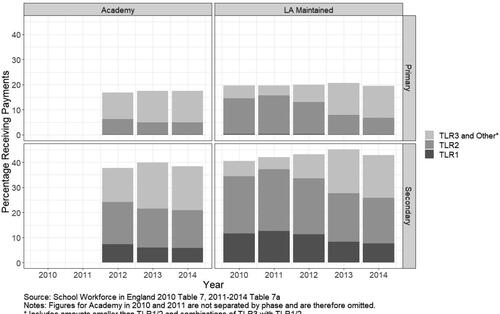
Figure 3. Percentage of qualified teachers receiving allowances (2010-11 to 2018-19).
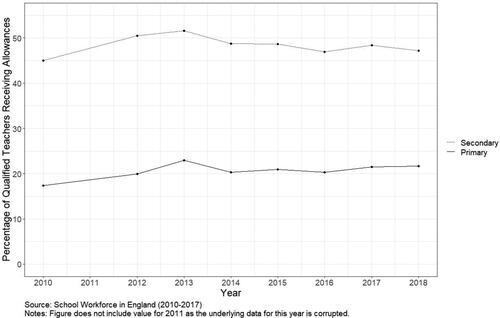
Figure 4. Numbers of types of worker per 100 pupils (2000-01 to 2018-19).
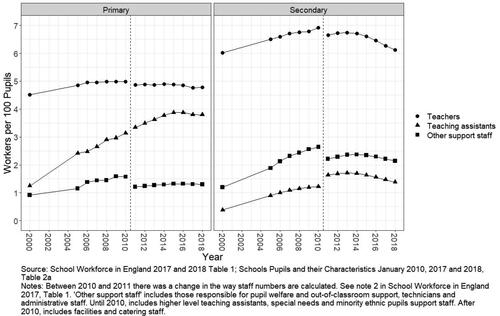
Table 1. Descriptive statistics for workforce dependent variables.
Figure 5. Estimated divergence of academies from LA maintained schools in the number of TAs and teachers per pupil (with 95% confidence intervals).
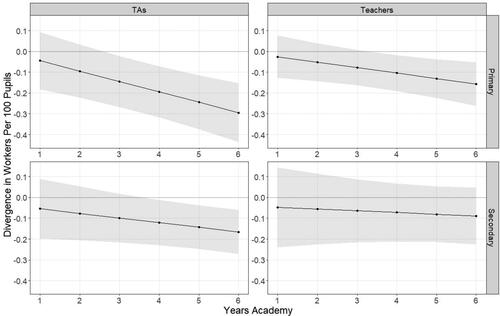
Figure 6. Estimated divergence of academies from LA maintained schools in the percentage of teachers in leadership positions (with 95% confidence intervals).
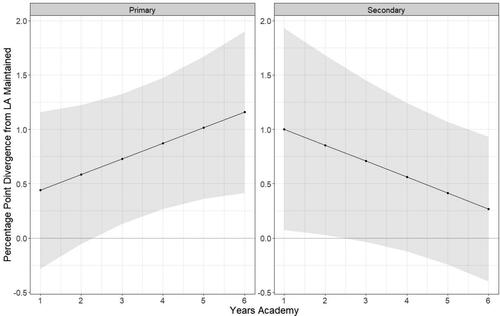
Table 2. Determinants of workforce characteristics in primary and secondary state schools in 2016.
Table A1. Primary state school determinants of percentage of teachers in leadership by baseline year.
Table A2. Primary state school determinants of number of teachers per 100 pupils by baseline year.
Table A3. Primary state school determinants of number of teaching assistants per 100 pupils by baseline year.
Table A4. Secondary state school determinants of percentage of teachers in leadership by baseline year.
Table A5. Secondary state school determinants of number of teachers per 100 pupils by baseline year.
Table A6. Secondary state school determinants of number of teaching assistants per 100 pupils by baseline year.
Table A7. Wald chi-squared test of joint significance statistics and significance levels for academy and academy type variables in .
Table A8. Differences in differences estimates of determinants of workforce characteristics in primary and secondary state schools (2010–2016).