Figures & data
Figure 1. Percentage of students receiving JASSO student loans by type of HE institution.
Sources: Japan Scholarship Foundation annual report and JASSO annual report.
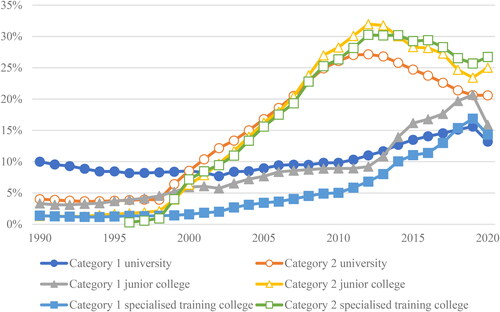
Table 1. Descriptive statistics (N = 377).
Table 2. Descriptive statistics on student loans by the type of HE institution.
Table 3. Tobit models regarding student loan debt.
Figure 2. Effects of each independent variable: average marginal effects and 95% confidence intervals.
Note: Reference categories in some variables are changed from .
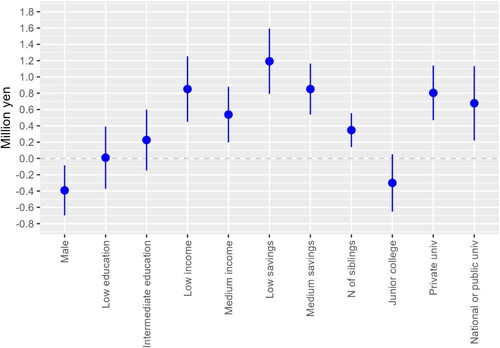
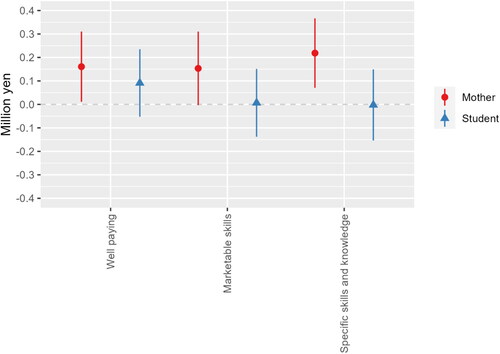
Figure 3. Effects of attitudes towards HE: average marginal effects and 95% confidence intervals.
Note: Each variable was standardised with a mean of zero and a standard deviation of one.
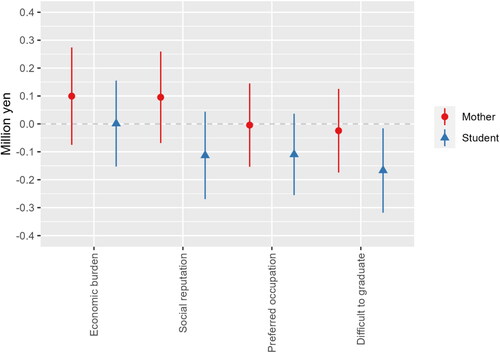
Figure 4. Effects of preferred job attributes: average marginal effects and 95% confidence intervals.
Note: Each variable was standardised with a mean of zero and a standard deviation of one.