
Figures & data
Table 1. High-level descriptive statistics showing LGBT+ populations in England and Wales and in HEIs.
Table 2. Percentage of bisexual professors and senior managers by age, compared to the percentage of bisexuals with level 4 qualifications or above.
Table 3. Exponentiated logistic regression coefficients for combined census data (individuals aged 16–64 with level 4 qualification and above) and HESA staff data.
Figure 1. Scatter plot showing the proportion of staff who are LGB+ against the proportion of degree holders aged 16–64 in the local tier local authority where the higher education provider is based. STEM and non-STEM cost centres are plotted separately. The horizontal line is our benchmark of the proportion of LGB+ degree holders aged 16–64 in England and Wales.
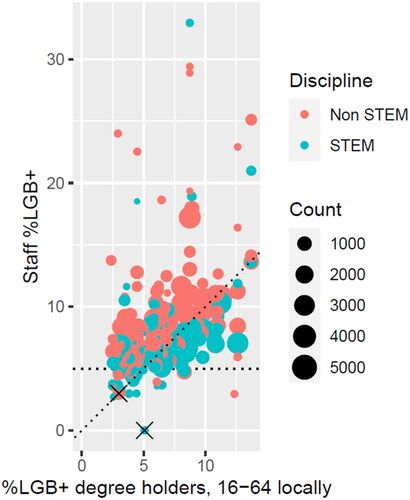
Table 4. Exponentiated logistic regression coefficients with outcome variables of being a professor and being a senior manager. In each model, the base case is of a male heterosexual non-STEM academic.
Table A1. Comparison of percentages in each LGB+ category when computed using raw data (top lines, upright text) and when computed using weightings to account for missing data (bottom lines, italic text).