
Figures & data
Table 1. Variable distribution by neighbourhood greenspace in the analytic sample (unweighted data)
Table 2. Multiple linear regression model for risk-taking (minimally adjusted model)
Table 3. Multiple linear regression model for risk-taking (excluding externalising/internalising problems)
Table 4. Fully adjusted multiple linear regression model for risk-taking (including externalising/internalising problems)
Table 5. Risk-taking by greenspace decile in the ‘stayers’ sample (N = 3,153) (weighted data)
Figure 1. Risk-taking by greenspace decile in the ‘stayers’ sample (N = 3,153) (weighted data).
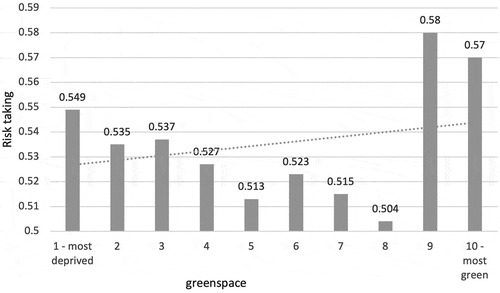
Table 6. Risk-taking by greenspace quintile in the ‘stayers’ sample (N = 3,153) (weighted data)
Figure 2. Risk-taking by greenspace quintile in the ‘stayers’ sample (N = 3,153) (weighted data).

Table 7. Risk-taking by greenspace (in quintiles) in the ‘stayers’ sample (N = 3,153); complete cases
Table 8. Risk-taking by greenspace (in quintiles) in the ‘stayers’ sample (N = 3,153); minimally adjusted model; complete cases
Table 9. Risk-taking by quintile of greenspace (greenest quintile as reference) in the ‘stayers’ sample (N = 3,153); complete cases
Table 10. Risk-taking by quintile of greenspace (greenest quintile as reference) in the ‘stayers’ sample (N = 3,153); minimally adjusted model; complete cases
Table 11. Risk-taking by quintile of greenspace (least green quintile as reference) in the ‘stayers’ sample (N = 3,153); complete cases
Table 12. Risk-taking by quintile of greenspace (least green quintile as reference) in the ‘stayers’ sample (N = 3,153); minimally adjusted model; complete cases