
Figures & data
Figure 1. Satellite image of MERIS algal pigment index 1 (API 1) for the southwest coast of Portugal with the inset showing locations of Stations A (37° 00′ 39″ N and 8° 53′ 58″ W), B (36° 56′ 06″ N and 8° 52′ 48″ W), and C (36° 51′ 33″ N and 8° 50′ 16″ W) off the peninsula at Sagres.
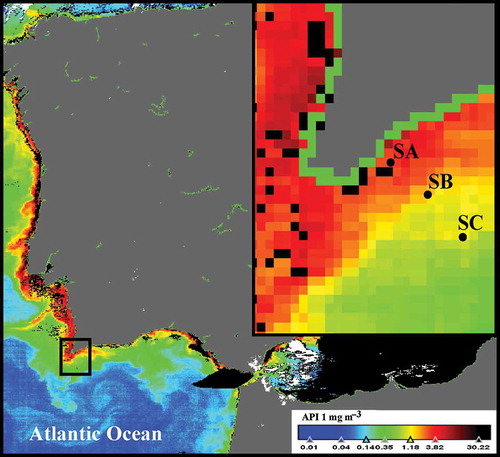
Figure 2. Gain spectra at 95% confidence limits for MERIS third reprocessing used for VIC (adapted from Lerebourg et al. (Citation2011)).
Table 1. Statistics for the bio-optical properties at Stations A, B, and C. Spectral diffuse attenuation coefficient at 490 nm (Kd(490)); algal pigment index 1 – total chlorophyll a and its degradation products (API 1); total suspended matter (TSM); absorption coefficient at 443 nm for phytoplankton (aph); absorption coefficient at 443 nm for non-algal particles (anap); and absorption coefficient at 443 nm for yellow substance (ays).
Figure 3. Ternary diagram for Stations A, B, and C showing the relative contribution of absorption coefficients at 443 nm for the absorption by phytoplankton (aph), the absorption by non-algal particles (anap), and the absorption by yellow substance (ays). Each measurement is represented by (+).
Table 2. Summary of the uncertainty budget for water-leaving reflectance (ρw) determined for the TACCS at Station A (SA), Station B (SB), and Station C (SC) for wavelengths 443, 490, and 560 nm.
Table 3. Number of matchups (N) with potential for MERIS validation in Sagres (Initial). Number of matchups after processing procedures, without vicarious adjustment (NoVIC); with vicarious adjustment (VIC); with ICOL processing (ICOL); with vicarious adjustment and ICOL processing (VIC+ ICOL) at Station A (SA), Station B (SB), and Station C (SC).
Figure 4. Scatter plots of MERIS water-leaving reflectance (ρw) versus in situ ρw at 443, 490, and 560 nm for Stations A, B, and C. The 1:1 relationship is represented by the solid diagonal line, whereas the linear regression for the data set is represented by the dashed lines. For each matchup point, the vertical bar indicates one standard deviation within the 3 × 3 pixel box used for the matchup and the horizontal bar represents the uncertainty budget for in situ ρw. Colours represent the different processing combinations with NoVIC (red), VIC (black), ICOL (green), and VIC + ICOL (blue).
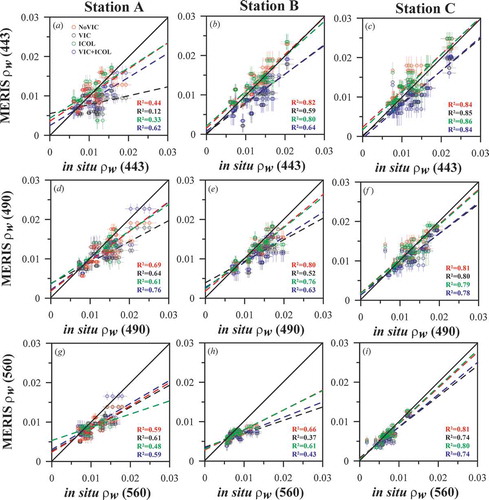
Figure 5. Histograms showing percentage differences for water-leaving reflectance (ρw) and curves for normal fit at 443, 490, and 560 nm for Stations A, B, and C. Colours represent the different processing combinations with NoVIC (red), VIC (black), ICOL (green), and VIC + ICOL (blue).
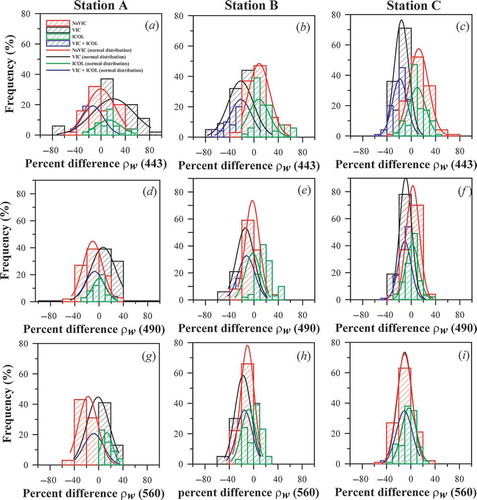
Table 4. Matchup statistics for MERIS water-leaving reflectance (ρw) for Stations A, B, and C with NoVIC.
Table 5. Matchup statistics for MERIS water-leaving reflectance (ρw) for Stations A, B, and C with VIC.
Table 6. Matchup statistics for MERIS water-leaving reflectance (ρw) for Stations A, B, and C with ICOL.
Table 7. Matchup statistics for MERIS water-leaving reflectance (ρw) for Stations A, B, and C with VIC + ICOL.
Figure 6. Transects of water-leaving reflectance (ρw) at 490 and 560 nm for 17 November 2008, 27 May 2009, 18 March 2011, and 24 November 2011 extending perpendicular from the coast up to approximately 24 km offshore. Each trace has undergone different processing combinations with NoVIC in red, VIC in black, ICOL in green, and VIC + ICOL in blue. The dashed vertical lines indicate the approximate locations of Stations A, B, and C from the coast with the value for in situ ρw shown as full black circles.
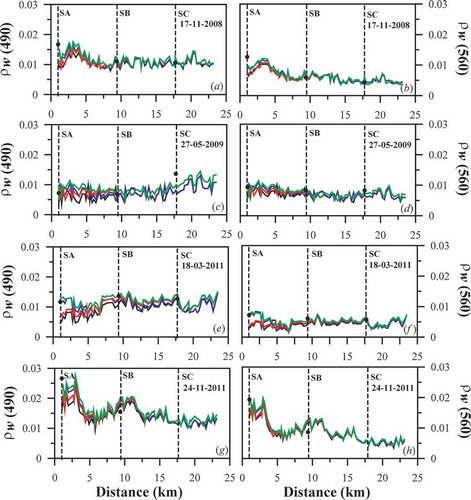
Figure 7. Water-leaving reflectance (ρw) at 560 nm from MERIS full-resolution satellite images from 17 November 2008, 27 May 2009, 18 March 2011, and 24 November 2011 at similar coordinates for the stations shown in . Each date shows images with different processing combinations NoVIC, VIC, ICOL, and VIC + ICOL.
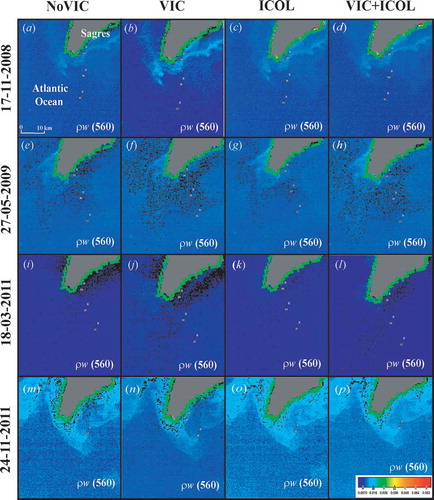
Table 8. Comparison of published statistical data for MERIS matchups with those at Sagres for wavelengths 443, 490, and 560 nm, where N = number of matchups, R2 = coefficient of determination, MR = mean ratio, RPD = relative percentage difference, and APD = absolute percentage difference.
Table 9. Matchup statistics for MERIS water-leaving reflectance (ρw) comparing BOUSSOLE (Antoine, Guevel, et al. Citation2008) with Station C at Sagres. The sample numbers (N) for BOUSSOLE are 20, 61, 64, 63, 64, and 64 for the wavelengths 412, 443, 490, 510, 560, and 665 nm, respectively. At Sagres, N = 115 for all the wavelengths listed in the Table.
Table 10. Comparison of MERIS matchups from AAOT site (*Zibordi et al. Citation201Citation3; †Kajiyama, D’Alimonte, and Zibordi Citation2014) with Sagres ocean Station C with MERIS water-leaving reflectance (ρw) after NoVIC in bold italics and after VIC in normal text for wavelengths 413, 443, 490, 560, and 665 nm, where N = number of matchups, R2 = coefficient of determination, RPD = relative percentage difference, and APD = absolute percentage difference.