Figures & data
Figure 1. Information relevant for biodiversity analysis that can be gained from remotely sensed data. We classify five types of variables, and examples of further products relevant for habitat analysis are presented. This is shown for the unitemporal case, assuming that only one data set is available and that multitemporal data or time series of data do not exist.
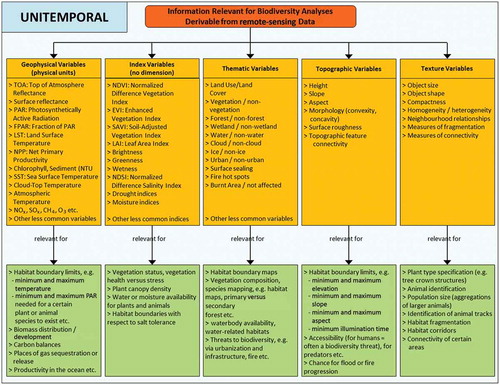
Figure 2. Information relevant for biodiversity analysis that can be gained from multitemporal remotely sensed data up to dense time series of data. Multitemporal data allow the monitoring of objects and habitats over time, and when long-term time series are available one can even observe trends (e.g. temperature shifts, snow cover duration shifts, etc.), and therefore slight geographic shifts of habitats.
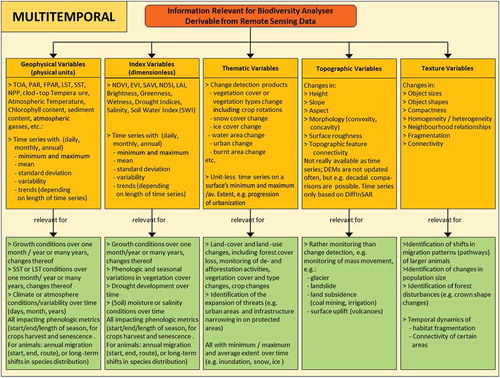
Figure 3. Timelines of major Earth observation satellites with optical/multispectral sensors.
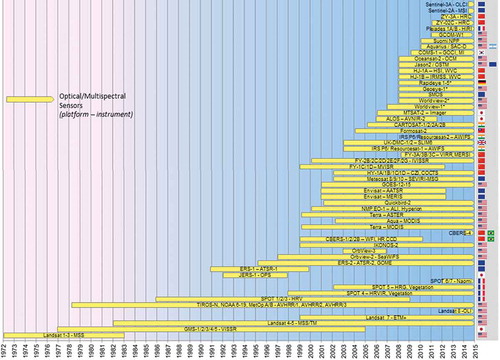
Figure 4. Timelines of major Earth observation satellites with thermal sensors.
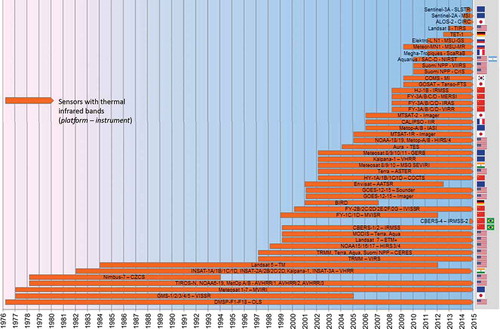
Figure 5. Timelines of major Earth observation satellites with radar and passive microwave sensing instruments.
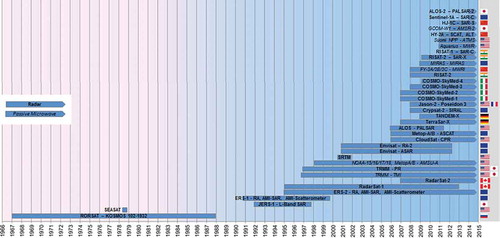
Figure 6. Optical/infrared (yellow) and radar (blue) sensors used for land-related applications.
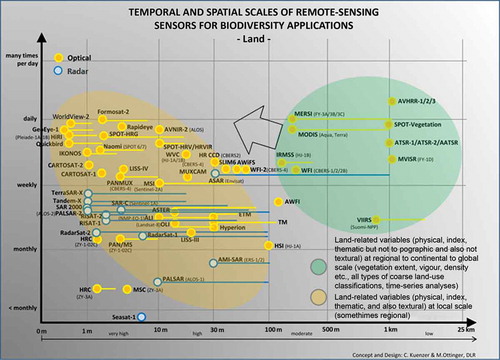
Table 1. “Land” application-related sensors.
Figure 7. Optical/infrared (yellow) and radar (blue) sensors for ocean/waterbody applications.
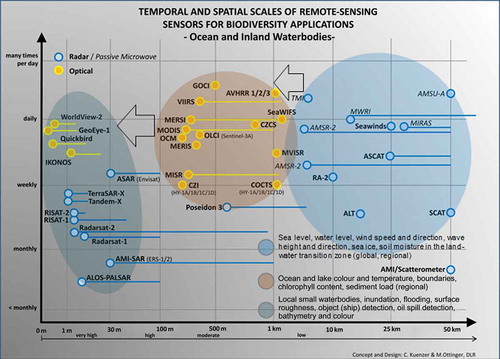
Table 2. “Ocean and inland waterbodies” application-related sensors.
Figure 8. Thermal sensors and the opportunities they offer for biodiversity-related applications.
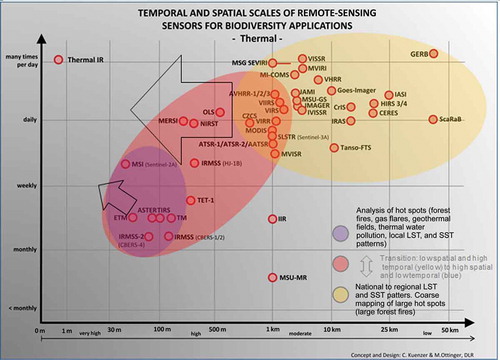
Table 3. “Thermal” application-related sensors.
Figure 9. Atmosphere-related sensors and products of interest for biodiversity applications.
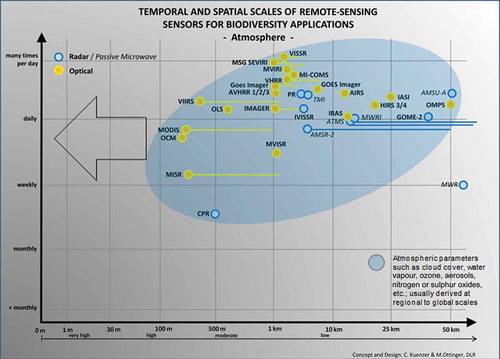
Table 4. “Atmosphere” application-related sensors.
Figure 10. Sensor data from which digital elevation models (DEMs) have been and can be derived.
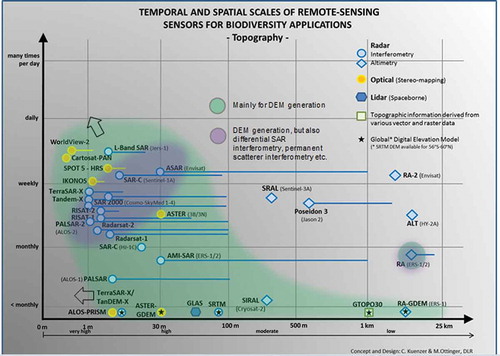
Table 5. “Topography”-related sensors.
Figure 11. Foci of sensor development and policy impacting data availability and continuity.
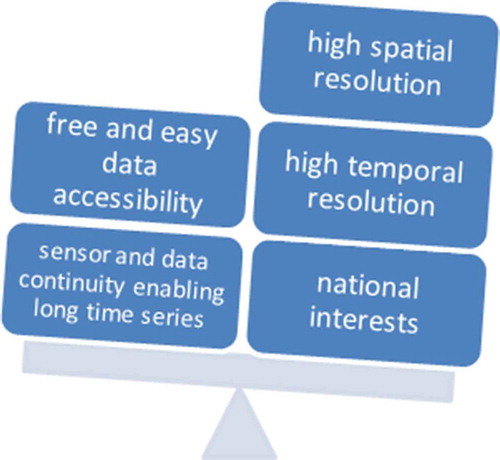
Figure 12. Appeal to governments, space agencies, and data providers.
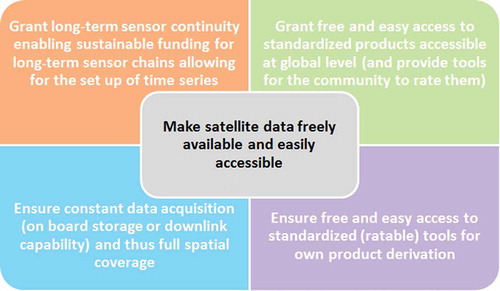
Figure 13. Our concept of an ideal “Species Distribution Visualizer and Modeller” based on remote-sensing data. If a near unlimited number of daily globally available variables could be provided as time series up to 30–40 years back into the past (plus granting future continuity), it would be possible to model selected past, current, and possibly future habitats of animals or vegetation species after simply moving a slider to define the crucial variables. Of course, additional biodiversity data including GPS migration and tracking data, field data (ground truth), and further ancillary data would increase the value of such a tool.