Figures & data
Table 1. Morphological properties of the lakes covered in this study.
Figure 1. Geographic map of Europe showing the location of the four lakes, and maps of Lakes Geneva, Balaton, Vänern, and Vättern showing the location of the field sampling stations.
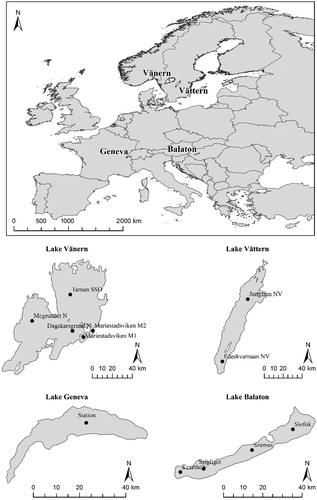
Table 2. List of chlorophyll-a (Cchl-a) estimation algorithms developed using Landsat TM and Daedalus 1268 ATM raw digital number (DN) data or Ltoa.
Table 3. List of chlorophyll-a (Cchl-a) estimation algorithms developed using Daedalus 1268 ATM and AISA Ltoa or nLw data.
Table 4. List of chlorophyll-a (Cchl-a) estimation algorithms developed using field spectroradiometer (FSR) Rtoa or Rrs data.
Table 5. List of SDD estimation algorithms developed using Landsat TM and AISA raw DN data or Ltoa.
Figure 2. Flowchart of the simulation of multispectral or hyperspectral data using other multispectral data.
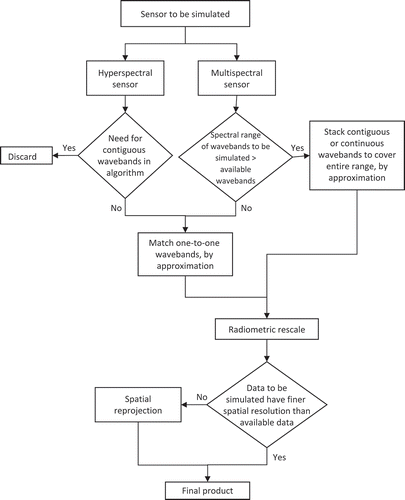
Table 6. Adaptation of MODIS spectral wavebands to simulate Landsat TM/ETM+ and Daedalus 1268 ATM wavebands used in this project.
Figure 3. AISA waveband centre wavelengths and corresponding Terra/Aqua MODIS waveband centres used in approximation. In grey the hyperspectral channels that approximated with the same MODIS waveband as another hyperspectral channel used in the same algorithm, or did not approximate any MODIS waveband, and therefore were not used.
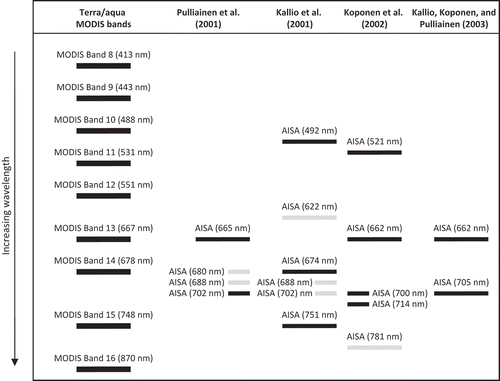
Figure 4. Waveband centres of field spectroradiometer-based algorithms and corresponding Terra/Aqua MODIS waveband centres used in approximation.
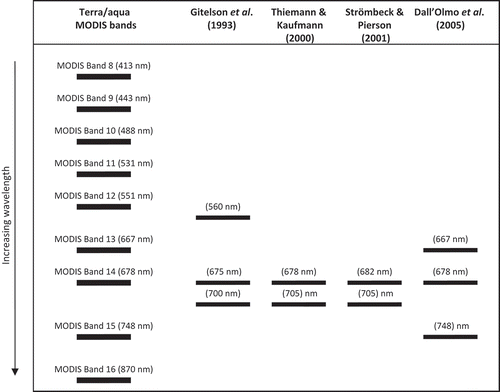
Figure 5. Relationship (linear regression) between field chlorophyll-a data and the MODIS OC3 estimates in Lakes Geneva and Vättern in years 2001–2004.
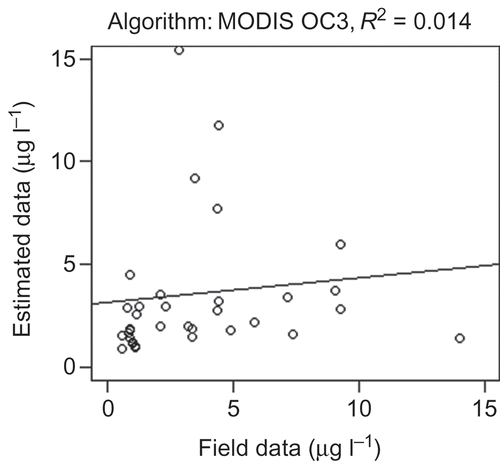
Table 7. Correlation of field chlorophyll-a data with corresponding simulated remotely sensed data (using Terra MODIS data only) for empirical algorithms in 2001–2004 in Lakes Geneva, Balaton, Vättern, and Vänern.
Table 8. Correlation of field chlorophyll-a data with corresponding simulated remotely sensed data (using Aqua MODIS data only) for empirical algorithms in 2001–2004 in Lakes Geneva, Vättern, and Vänern.
Table 9. Correlation of field chlorophyll-a data with corresponding simulated remotely sensed data (using both Terra and Aqua MODIS data) for empirical algorithms in 2001–2004 in Lakes Geneva, Balaton, Vättern, and Vänern.
Figure 6. Scatterplots of empirical chlorophyll-a algorithms that showed strong correlation with field data in Lakes Vättern and Vänern when both Terra and Aqua MODIS data (a) and only Terra MODIS data (b, c) were used, and in Lakes Geneva, Balaton, Vättern, and Vättern when only Terra MODIS data were used (d–f).
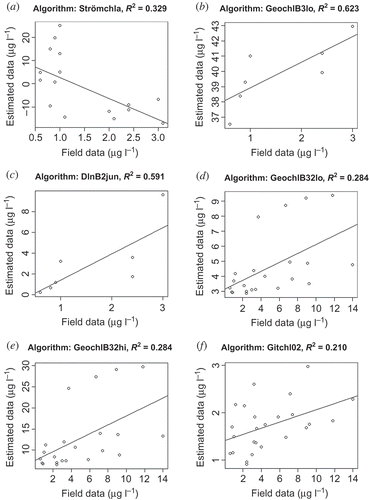
Table 10. Correlation of field SDD data with corresponding simulated remotely sensed data for empirical algorithms in 2001–2004 in Lakes Geneva, Vättern, and Vänern.
Table 11. Accuracy measures of empirical chlorophyll-a and SDD algorithms, the outputs of which showed strong correlation with field data in Lakes Geneva, Balaton, Vättern, and Vättern.
Figure 7. Lake Geneva: Scatterplots of empirical Secchi disc depth algorithms that showed the strongest correlation with field data when only Terra MODIS data were used.
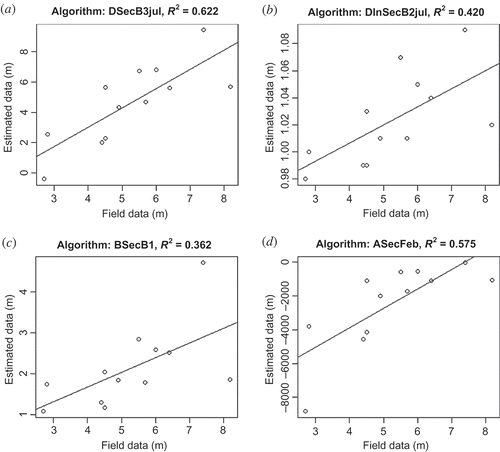
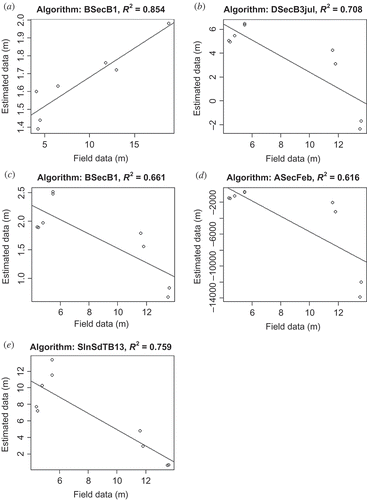
Figure 8. Lakes Vättern and Vänern: Scatterplots of empirical Secchi disc depth algorithms that showed the strongest correlation with field data; only Terra MODIS data (a), only Aqua MODIS data (b–e).