
Figures & data
Figure 1. The Niger Delta is shown in green colour within the map of Nigeria.
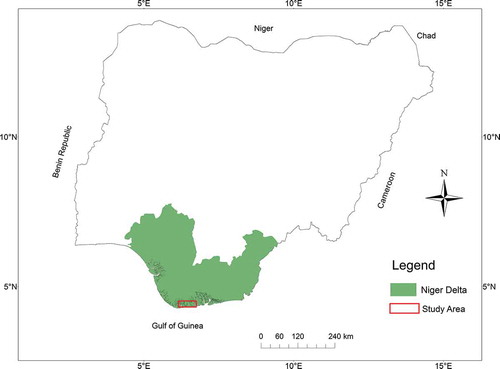
Figure 2. Landsat data in false colour composite (bands 4, 3, and 2) showing oil spill points and pipelines in the study area.
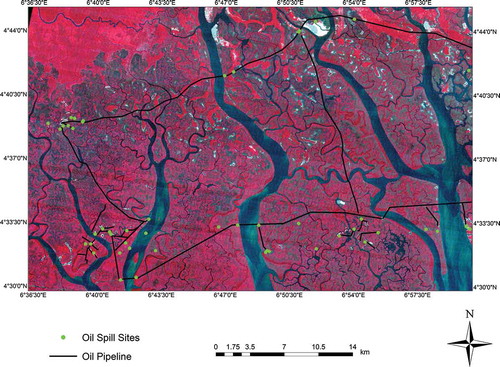
Table 1. Year of oil spills, sample points, and available image data.
Figure 3. Landsat-5 and -7 images in false colour composite (bands 4, 3, and 2) of the study area.
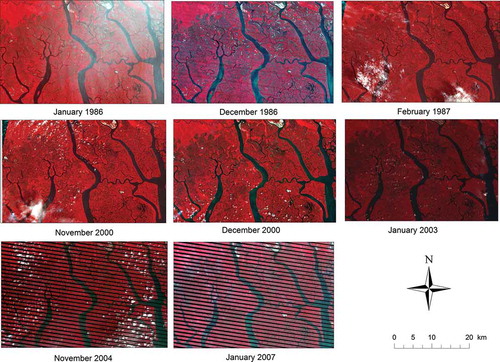
Table 2. Number of sample points, volume of oil spill, and time gap between oil spill and image dates.
Figure 4. Relationship between NDVI and NDWI and all volumes of oil spill.
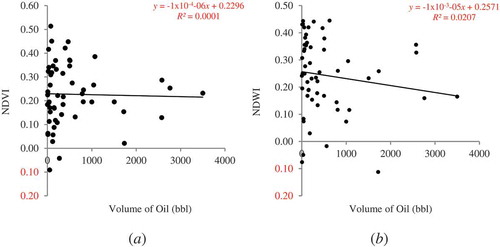
Figure 5. Relationship between (a) NDVI and (b) NDWI and volume of oil spill where the volume was greater than 225 bbl.
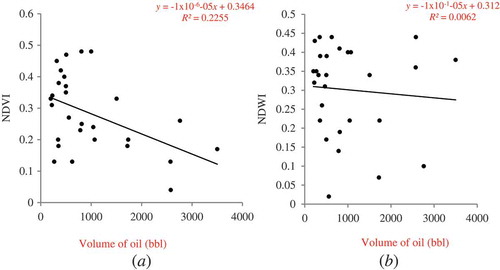
Figure 6. Variation in relationship between NDVI and NDWI and volume of oil for different oil spill volume ranges: 6(a) and 6(b), 225–400 bbl; 6(c) and 6(d), 401–1000 bbl; and 6(e) and 6(f), 1001 bbl and above.
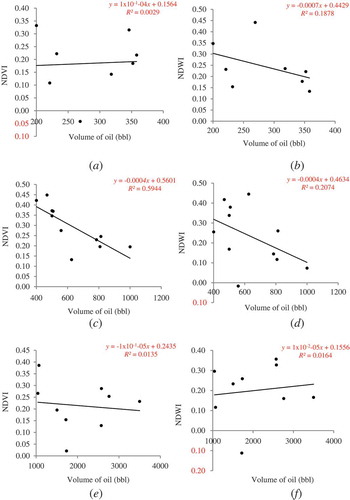
Table 3. Time gap between oil spill and image dates and NDVI and NDWI for 25 spill sites with volume of oil spill volumes of more than > 225 bbl.
Figure 7. Relationship between time gap (number of days between oil spill and image date) and (a) NDVI and (b) NDWI in polluted sites.
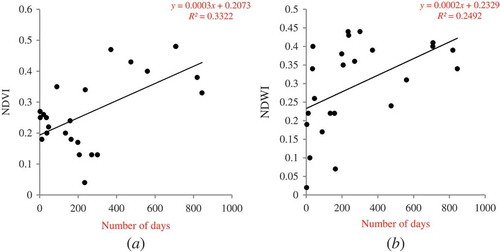
Figure 8. The relationship between time [< 1 year 8(a) and 8(b) and 1–2 years 8(c) and 8(d)] and the two vegetation indices (NDVI and NDWI).
![Figure 8. The relationship between time [< 1 year 8(a) and 8(b) and 1–2 years 8(c) and 8(d)] and the two vegetation indices (NDVI and NDWI).](/cms/asset/f6321c51-ae81-48c1-8922-c597bb1a989c/tres_a_1176271_f0008_c.jpg)