Figures & data
Table 1. Overview of the nine weather stations in Burkina Faso and observations used in the validation.
Figure 1. Relief map of Burkina Faso with synoptic stations location and location within Africa.
Table 2. Summary of the seven satellite products used.
Table 3. Number of daily ground observations and aggregated totals per synoptic station used in the study.
Table 4. Continuous statistics (, gauge rainfall measurement;
, average gauge rainfall measurement;
, satellite rainfall estimate;
, average satellite rainfall estimate; and
, number of data pairs) and categorical statistics (
, number of hits;
, number of false alarms; and
, number of misses).
Table 5. Dekadal statistical indicators.
Figure 2. Scatter plots of dekadal accumulated rainfall from rain-gauge stations versus ARC, CHIRPS, PERSIANN, RFE, TARCAT, and TRMM 3B42 data at the point-based station locations scale.
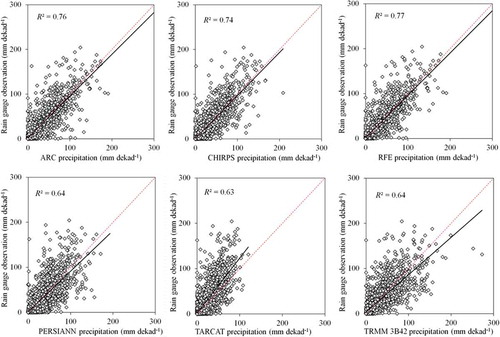
Table 6. Monthly statistical indicators.
Figure 3. Scatter plots of monthly accumulated rainfall from rain-gauge stations versus ARC, CHIRPS, PERSIANN, RFE, TARCAT, TRMM 3B42, and TRMM 3B43 data at the point-based station locations scale.
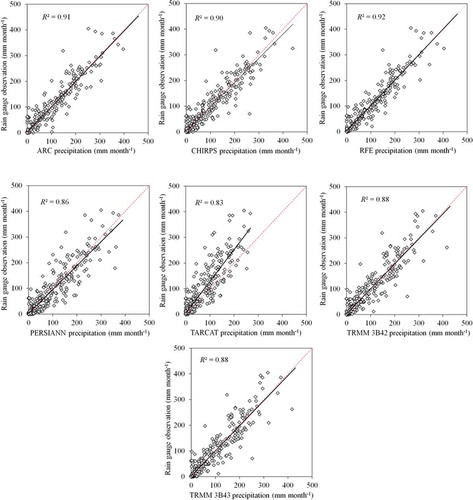
Figure 4. Occurrence frequencies of monthly precipitation in different precipitation intensity ranges and their relative contributions to total precipitation. ‘Occurrence’ in the legend means the occurrence frequency of each class, and ‘Contribution’ means the relative contribution of each class.
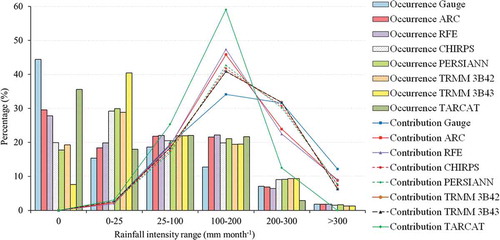
Table 7. Annual statistical indicators.
Figure 5. Scatter plots of annual accumulated rainfall from rain-gauge stations versus ARC, CHIRPS, PERSIANN, RFE, TARCAT, TRMM 3B42, and TRMM 3B43 data at the point-based station locations scale.
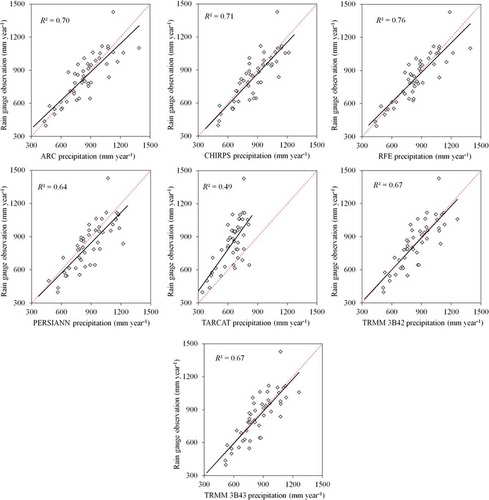
Figure 6. Mean (2001–2014) total annual rainfall for the different satellite-based rainfall products.