
Figures & data
Figure 1. Study area.
Table 1. Forest map nomenclature.
Table 2. Indices describing the topographical and landscape characteristics of the strata.
Table 3. Indicators used for accuracy assessment.
Figure 2. PCA results: (a) projection on the two first factors (PC1 and PC2) of the monthly average EVI images; (b) projection on the two first factors (PC1 and PC2) of the five texture indices (Dissi, Dissimilarity; SecMom, Second Moment; Homo, Homogeneity) and EVI for the month April (04).
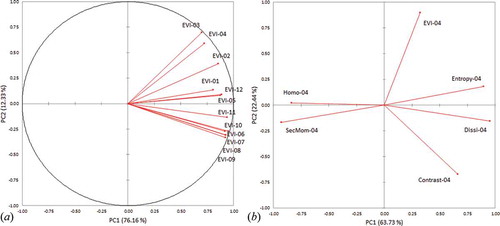
Figure 3. Results (Johnson’s and Zhang’s curves) obtained using three dates of EVI and each of the five texture indices averaged over five years (2007–2011): (a) second moment, (b) contrast, (c) dissimilarity, (d) homogeneity, and (e) entropy.
Figure 4. Stratification of the study area obtained after merging and eliminating unprocessable strata.
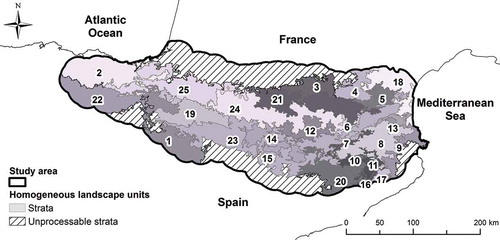
Table 4. Values calculated for the eight landscape indices describing the 25 strata.
Table 5. Accuracy assessment obtained with and without stratification for the two studied periods (kappa coefficient (κ) and reject fraction).
Table 6. Stratification effect on the producer’s accuracy, NDVI series for the 2007–2009 period.
Figure 5. κ and RF values for the 25 strata with and without stratification.
Figure 6. Relation between κ and RF differences with and without stratification for the 25 strata.
Figure 7. (a) Relation between the per-stratum kappa coefficient (κ) value with stratification and the stratum area (ha). (b) Relation between the per-stratum κ value without stratification and the stratum area (ha).
Table 7. Coefficient of determination (R2) between the stratum indicators and the per-stratum κ and RF differences for the 2007–2009 period (bold: significant for α = 0.01; (+): positive correlation; (-): negative correlation).
Figure 8. Relation between stratum area (ha) and κ difference.
Figure 9. Classified vegetation area (ha) – strata order by group and increasing with stratum area.
Figure 10. Relation between the standard deviation of elevation (m) and the κ difference considering the strata groups A, B, and C.
Figure 11. Relation between standard deviation of the patch area (ha) and κ difference considering the strata groups A, B, and C.
Figure 12. Relation between number of classes and κ difference considering the strata groups A, B, and C.
Table 8. Segmentation results according to 15 and 20 scale parameter values.