Figures & data
Figure 1. Upper left image: TSX image of 9 March 2015 in with the selected GCPs (G1–G7). The other images are zoomed around each of the encircled GCPs.
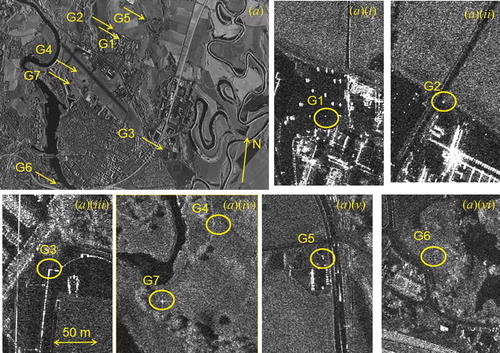
Figure 2. UTM geocoded staring spotlight image, 10 March 2015 in . Pixel spacing is 1.8 m for the Northing (vertical) and Easting (horizontal). Scene centre: 59 º 59ʹ 10ʺ N, 11º 3ʹ 0ʺ E.
Figure 3. UTM geocoded StInSAR-derived DEM, 10 March 2015 in . Pixel spacing is 1.8 m for the Northing and Easting.
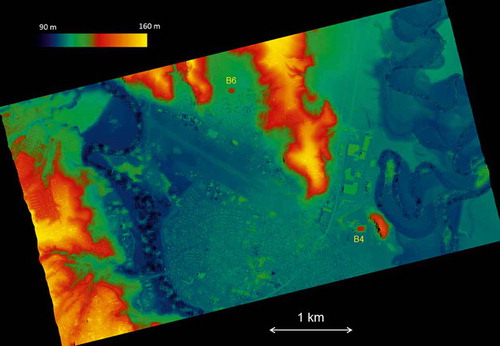
Figure 4. Sub-images of and showing some buildings (B1–B5). B4 is shown in .
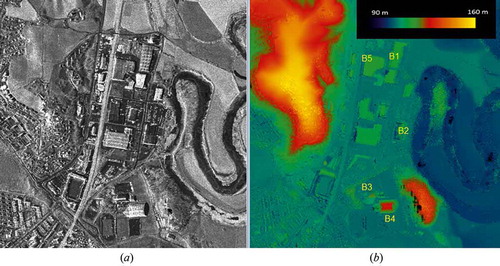
Figure 5. Staring spotlight image over Nikel in Russia on 4 February 2015 in . G1 is the GCP and A1–A3 are small regions for the estimation of height.
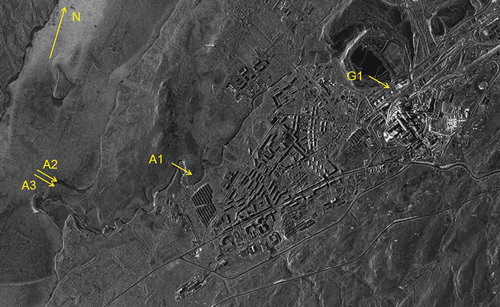
Figure 6. Interferogram from the same time and area as in .
Figure 7. UTM geocoded DEM with a pixel spacing of 1.8 m derived from the interferogram in . Scene centre: 69 º 24ʹ 36ʺ N, 30º 12ʹ 11ʺ E.
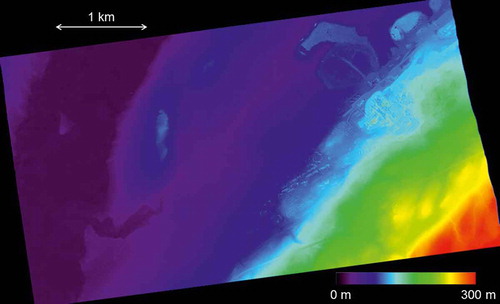
Figure 8. (a) UTM geocoded DEM of 22 December at incidence angle 47º in an area around the A1 point shown in . (b) Average of six DEMs at 47º.
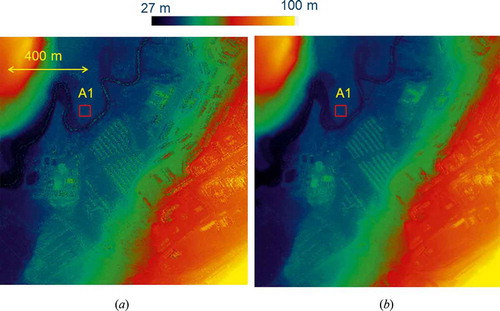
Table 1. Ascending CoSSC interferometric pairs from test site Kjeller (scene centre: 59 º 59ʹ 10ʺ N, 11º 3ʹ 0ʺ E). The size of staring spotlight scenes is around 3 km × 6 km. The pixel size in azimuth is 0.17 m and in range 0.79 m.
Table 2. Ascending CoSSC mono-static staring spotlight interferometric pairs from test site Nikel (scene centre: 69 º 24ʹ 36ʺ N, 30º 12ʹ 11ʺ E). The size of staring spotlight scenes is around 3 km × 6 km. The pixel size in azimuth is 0.17 m and in range 0.79 m.
Table 3. Ascending CoSSC interferometric pairs from test site Åraksbø (scene centre: 58º 56ʹ 20ʺ N, 7º 47ʹ 2ʺ E). The size of spotlight scenes is around 5 km × 10 km. The pixel size in azimuth is 0.86 m and in range 0.79 m.
Table 4. Stereo-estimated heights and DGPS heights of the ground control points (GCPs) and reference points in test site Kjeller.
Table 5. Mean error (ME) and root mean square error (RMSE) heights estimated over four GCPs (G1, G2, G3, and G5) in the four staring spotlight scenes in .
Table 6. ME and RMSE estimated over 14 trigonometric points in the four staring spotlight scenes in for each of the GCPs.
Table 7. Heights of buildings B1–B7 in and obtained with three different methods.
Figure 9. Averaged time series of DEMs at different incidence angles in a small region around the A2 and A3 points shown in . The dates of the DEMs for each incidence angle are: (a) Incidence angle = 27°. Dates: 29 December, 9 January, 20 January, 11 February, 22 February. (b) Incidence angle = 35°. Dates: 23 December, 3 January, 14 January, 16 February, 27 February, 10 March. (c) Incidence angle = 41°. Dates: 17 December, 28 December, 8 January, 19 January, 10 February, 21 February. (d) Incidence angle = 47°. Dates: 22 December, 2 January, 13 January, 4 February, 15 February, 9 March. (e) Incidence angle = 52°. Dates: 16 December, 27 December, 7 January, 9 February, 20 February, 3 March.
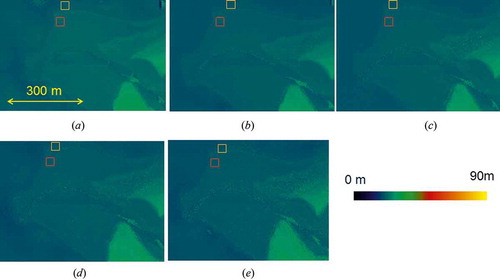
Figure 10. Photograph taken by Johnny Foss over Åraksbø with powered paragliding on 19 July 2012 with licence from Norwegian airsport federation.
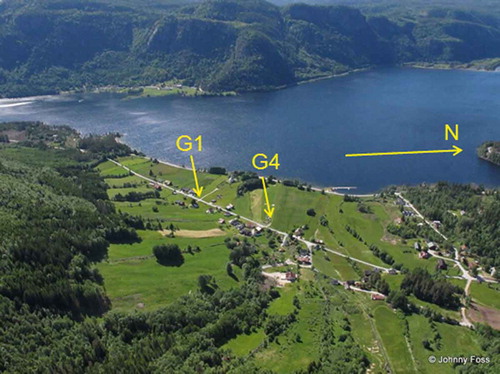
Figure 11. Bi-static spotlight image over Åraksbø on 16 November 2015 in .
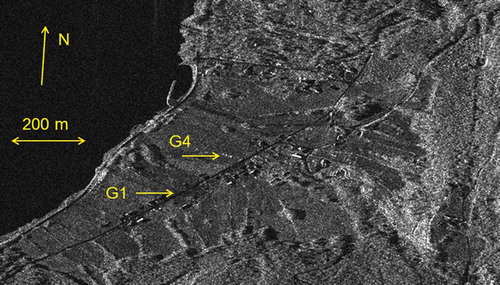
Figure 12. (a) Coherence of the bi-static image pair on 5 November 2015 in . Azimuth time difference of TSX and TDX is 0.03 s. (b) Coherence of the mono-static image pair of 21 December 2014 in . Azimuth time difference of TSX and TDX is 10 s.
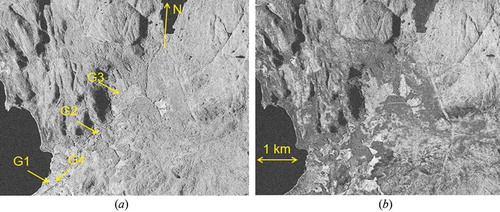
Figure 13. UTM geocoded DEM derived from the bi-static interferometric image pair of 16 November 2015 in . Pixel spacing is 2.0 m for the Northing and Easting. Scene centre: 58º 56ʹ 20ʺ N, 7º 47ʹ 2ʺ E.
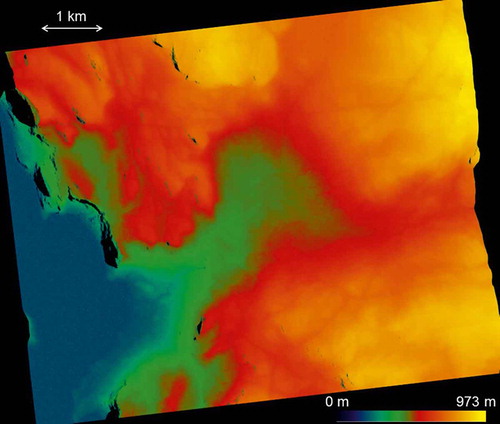
Figure 14. Difference of the DEM in and the DTM from NMA.
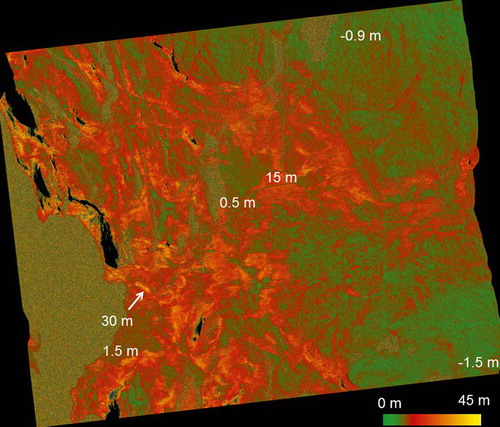
Table 8. Mean error (ME) and root mean square error (RMSE) in the four mono-static scenes from using four stereo points and five trigonometric points as references.
Table 9. Mean error (ME) and root mean square error (RMSE) in three bi-static scenes from using four stereo points and five trigonometric points as references.
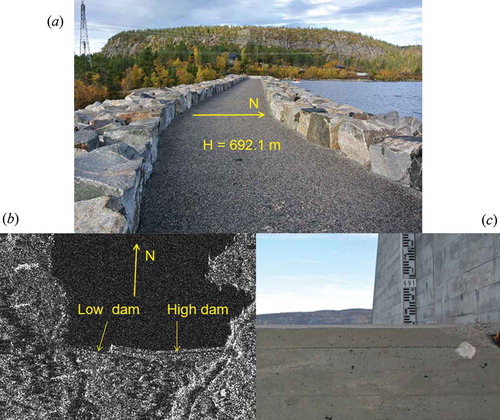
Figure 15. (a) Road upon the high hydropower dam. (b) SAR image showing low and high hydropower dam at Hovatn. (c) Low and high dam with the measuring stick. Photographs: Knut Eldhuset, October 2015.