Figures & data
Figure 1. Examples of DNB imagery using (a) a simple linear and (b) a simple logarithmic scaling for a half moon scene over Europe and North Africa collected on 25 August 2016 from 01:26:08Z to 01:38:54Z. Grid lines show the latitudes/longitudes (yellow).
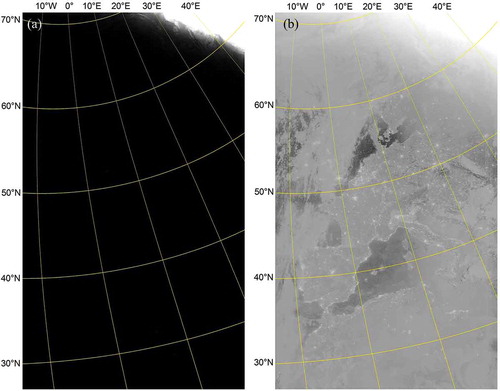
Figure 2. 2D histogram of biased radiances as a function of the sun zenith angle for a new-moon scene on 2 August 2016 from 01:51:40Z to 02:18:40Z, 256 × 256 bins. The vertical black reference lines refer to the different regions of the correction curve introduced in the next section.
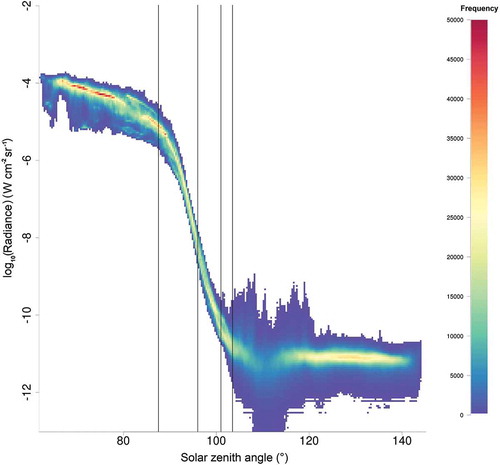
Figure 3. Zenith-angle-dependent gain factors.
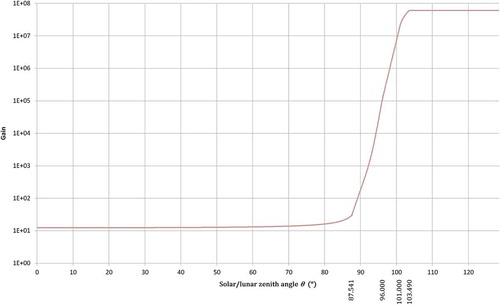
Figure 4. 2D histogram of normalized radiances for the new-moon scene shown in (2 August 2016 from 01:51:40Z to 02:18:40Z), 256 × 256 bins. The vertical black reference lines refer to the different regions of the correction curve introduced in Equation (1). The horizontal reference line is the cut-off value of 0.075.
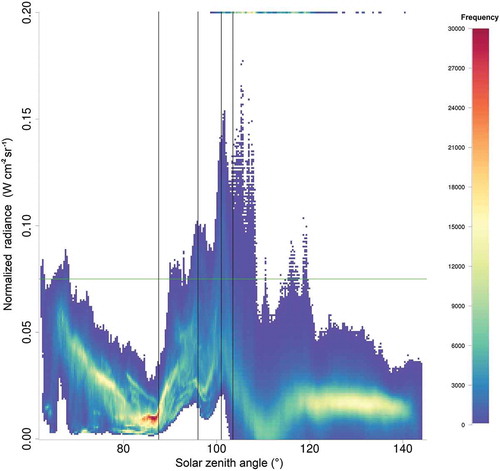
Figure 5. HNCC imagery showing Europe and North Africa (a) in the night-time at new moon (1 September 2016 from 00:44:42Z to 01:13:08Z) and (b) during daytime (1 September 2016 from 12:18:53Z–12:44:28Z). Grid lines show the sun zenith angle (numbers right of images) and the moon zenith angle (numbers left of images) in degrees.
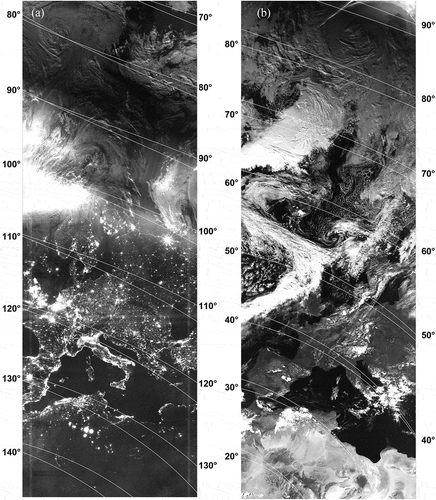
Figure 6. Movement of a weather system from the Atlantic Ocean over western France. (a) shows a scene on 17 August 2016 around 02:20Z (one day to full-moon), (b) roughly the same region on the same day during daylight around 13:50Z, and (c) the same region on 18 August 2016 around 02:00Z (full moon). The narrow black horizontal stripe over Great Britain and France in (a) is due to a reception dropout in the Direct Broadcast reception.
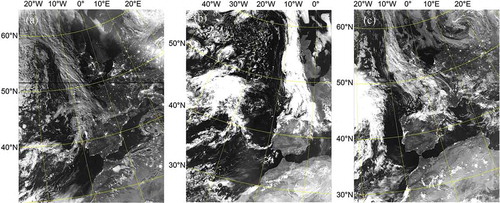
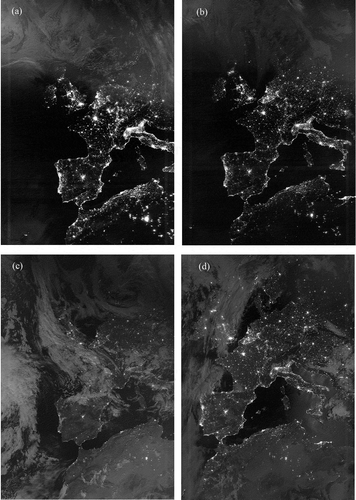
Figure 7. HNCC imagery showing Europe and North-West Africa (a) during new-moon (2 August 2016), (b) quarter-moon waxing (8 August 2016), (c) full-moon (18 August 2016), and (d) half moon waning (25 August 2016). Grid lines show the sun zenith angle (numbers right of images) and the moon zenith angle (numbers left or below of images). Note that in the quarter-moon scene (b) the moon has not risen above the horizon, yet.
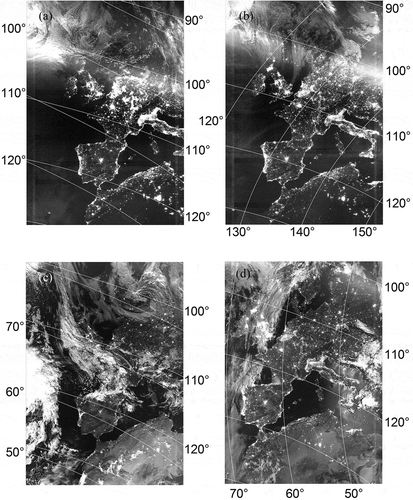
Figure 8. Corrected half-moon scene (25 August 2016 from 01:26:08Z to 01:38:54Z) using different cut-off values: (a) 0.060, (b) 0.100 and (c) 0.140.
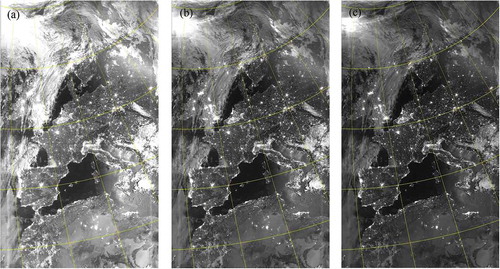
Figure 9. Same as in but using NCC images.
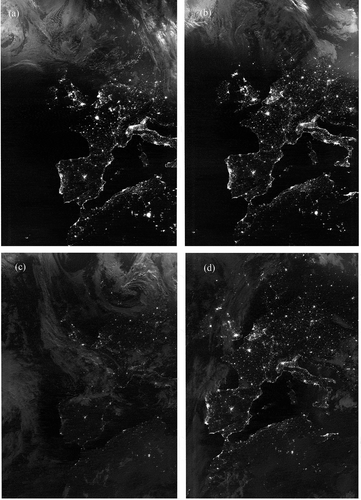
Figure 10. Same as in but using images created through ERF dynamic scaling. Images provided by Dr Curtis Seaman.