
Figures & data
Figure 1. The spectral response functions of NPP/VIIRS and Aqua/MODIS solar reflectance bands (red is for VIIRS and blue is for MODIS). The VIIRS DNB SRF is the version after 4 April 2013.
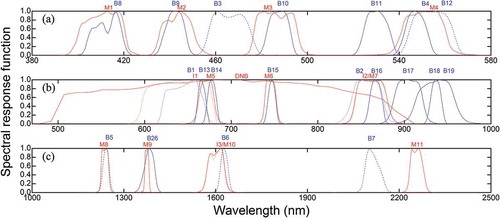
Figure 2. Coordinate map of 11 spot measurements.
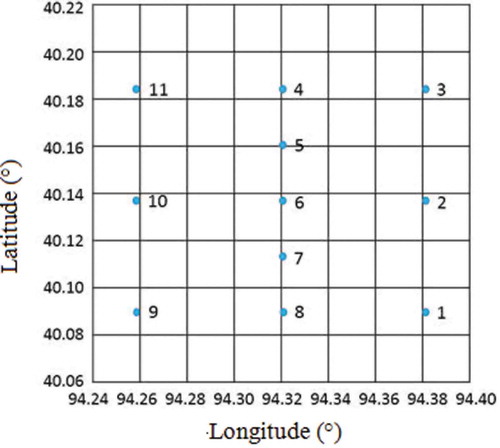
Figure 3. Ground view from 30 m height tower crane at site No.1.
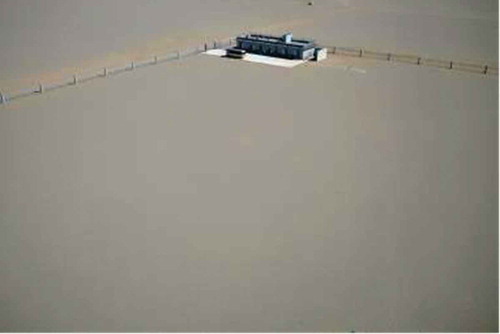
Table 1. Atmospheric parameters and sensor angles information.
Figure 4. The aerosol optical depth at 550 nm, measured on 14, 16, 20, and 21 August 2015 at Dunhuang site No. 1.
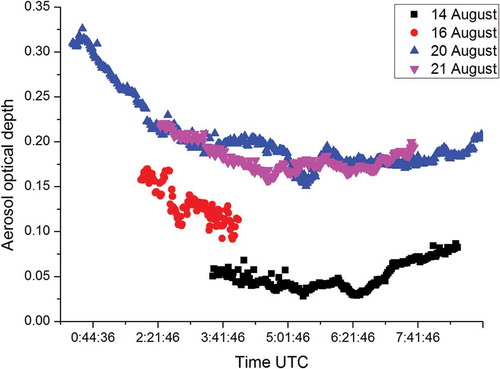
Figure 5. The surface reflectance of measurement spot No. 6 on 21 August 2015, before (black line) and after (red line) BRDF correction, and their relative bias (blue line).
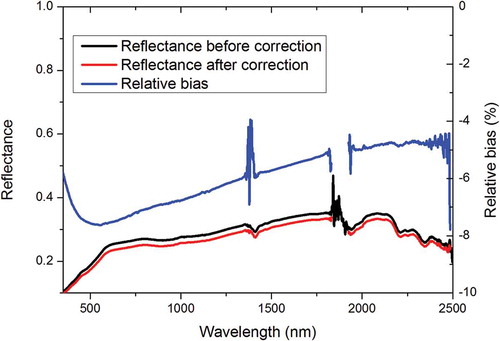
Figure 6. (a) Radiometric calibration bias results for NPP/VIIRS solar reflectance bands (except M6 and M9 bands) on 16 August (red dot) and 21 August (black square) and the bar for the standard deviation (SD); (b) the 2-day mean bias for each band (black square) and the difference between the 2-day results (based on the result on 16 Aug) (red dot).
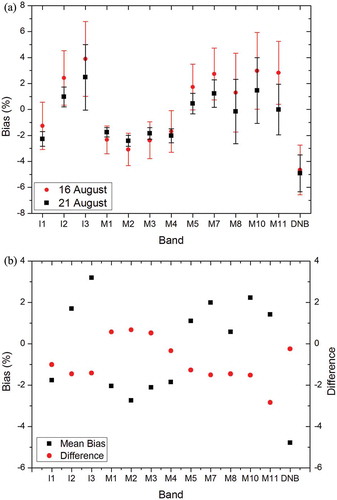
Figure 7. The evaluation results of Aqua/MODIS band 1 to band 7. The red square is the mean bias and the red bar is the 1-σ SD for each band.
Table 2. The radiometric calibration consistency for VIIRS and MODIS.
Table 3. Two-way gas transmittance in MODIS B7, VIIRS M11, and VIIRS DNB calculated by 6S and MODTRAN.
Table 4. The radiometric calibration evaluation for VIIRS and MODIS and their consistency in M11 and B7 before and after gas transmittance correction.
Table A1. Radiometric calibration bias results for NPP/VIIRS solar reflectance bands (except M6 and M9 bands) on 16 August and 21 August.
Table A2. Radiometric calibration bias results for Aqua/MODIS solar reflectance bands (B1–B7) on 21 August.