
Figures & data
Figure 1. Location of our study area. (a) Regional map for the vicinity of Gedaref City (open circle) in Southeast Sahel showing daily rainfall for 27 July 2006 (5 mm), based on TMPA 3B42 estimates. Elevation contour interval is 200 m, with Gedaref State shown by the hatched area. (b) Local map showing the location of three cooperative gauge sites in addition to the principal WMO Gedaref gauge. Elevation contour interval is 50 m.
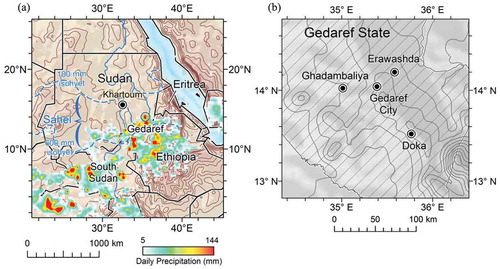
Figure 2. Daily precipitation time series for the TMPA 3B42 product (panel (a)) compared with GED WMO gauge values (panel (b)) for the 1999 − 2015 epoch. Panel (c) shows daily differences or deviations between pairs of the principal daily rainfall metrics of this study: gauge and 3B42, where (3B42-GED gauge).
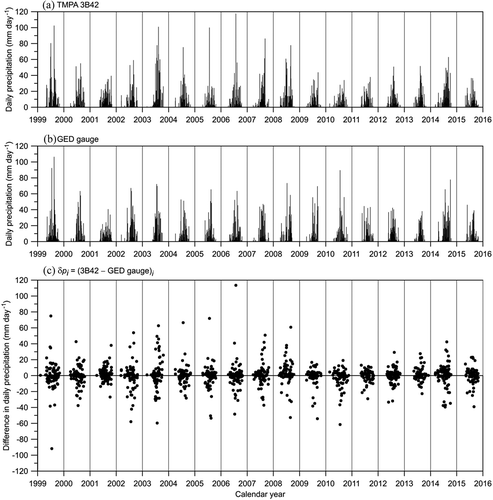
Figure 3. Regression analysis between the principal daily rainfall metrics of this study (3B42 versus GED gauge values) for the period of record 1999 − 2015. Data pairs are purged of couplets having zeros in common. Dashed line is only for reference showing a unit slope.
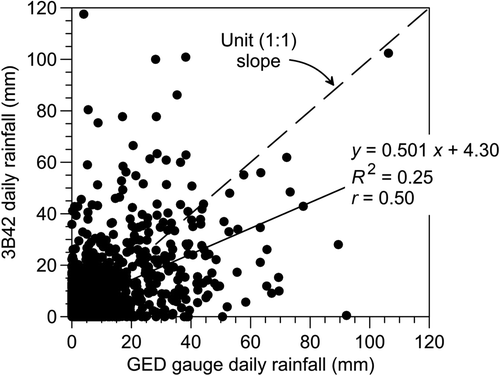
Figure 4. Enlarged overlays, 5 July 2006 to 18 August 2006, of GED gauge and 3B42 daily time series, around the date 27 July 2006, the maximum storm-day of record of the 3B42 database for the period of record, 1999 − 2015. See for the areal coverage of the 27 July 2006 event.
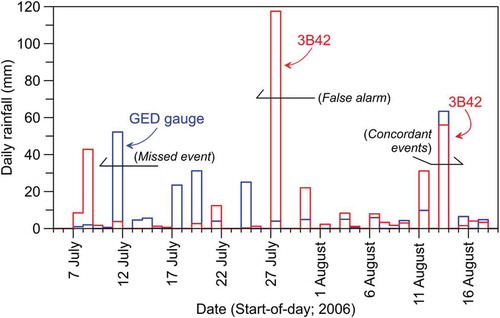
Table 1. Compare estimated intensity of the seven maximum SPE events with highest ranked gauge observations: 1999−2015.
Table 2. 1999–2015 Summary of 3B42 misassignment of daily rainfall. 77 days year-1. Annual bias = 2.2%.
Table 3. Cumulative statistics on the daily deviation of 3B42 from GED gauge (1301 events; 1999−2015) .
Figure 5. Statistical distributions of the signed daily deviations of 3B42 from gauge values p plotted along the abscissa (x-axis), where the quantile with respect to the ordinate (y-axis) is the fraction of the respective base total, which is either the annual mean number of storm-days per year, or the total annual anomaly or misrepresented rainfall per year.
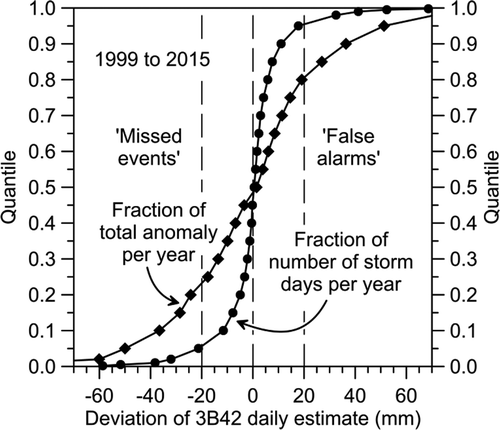
Table 4. Compare summary statistics for the principal GED data set for 1999–2015, with complementary data sets from three cooperative gauge sites for 2010–2013.