Figures & data
Figure 1. The insert figure is the location of country/province/the Nigeria’s Niger Delta’ (image data false colour composite (bands 5, 4 and 3)), pipeline and oil spill sites.
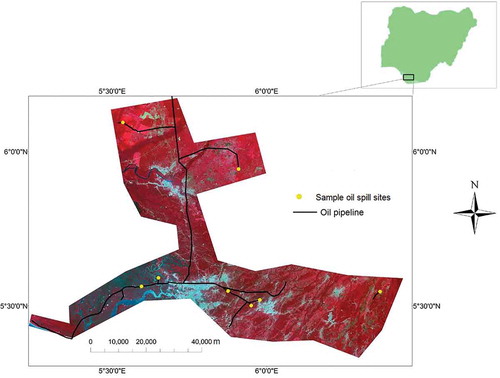
Table 1. Information on oil spill data for the study site.
Figure 2. Box plot for the calculated mean of the 5 vegetation indices from (SS) and (NSS) sites for the 18 sample points each in 23 December 2014, where Q stands for quartile.
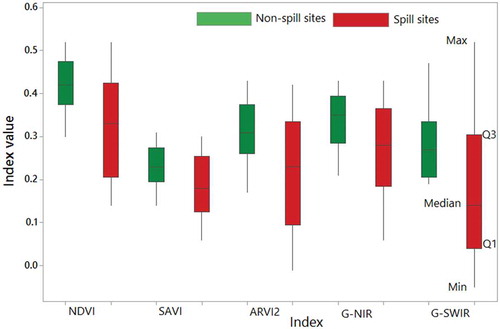
Figure 3. Oil spill sites (SS2 and SS4) detected by Landsat data (a & b) and NDVI (c & d) for 20 December 2013 and 23 December 2014.
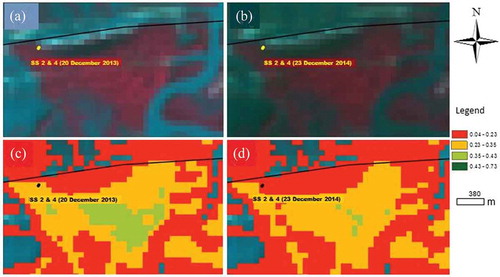
Table 2. A comparison of p-value from paired t-test analysis for the study sites (SS and NSS sites) in 23 December 2014.
Table 3. Analysis of change detection using paired t-test statistics of means of vegetation indices at the SS and NSS.
Table 4. shows the t-test analysis of the mean values for indices of vegetation affected by oil spill at the SS.
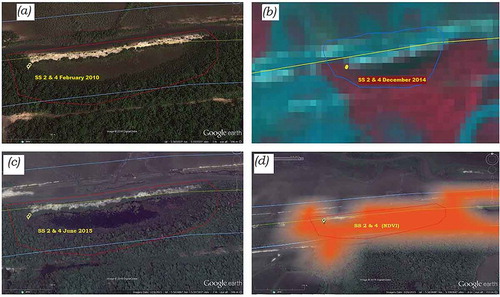
Figure 4. Oil spill sites (SS2 and SS4) detected in (b) Landsat data shown in Google Earth image of (a) February 2010, (c) June 2015 and (d) NDVI overlaid on 10 January 2015 Google image.