Figures & data
Figure 1. Geographical localization and hillshade model (derived from a 10 m DEM) of the Valle d’Aosta Region. The landslide contours and the DSGSD are included in the IFFI catalogue of VdA. The map is overlaid on a ESRI World Imagery map
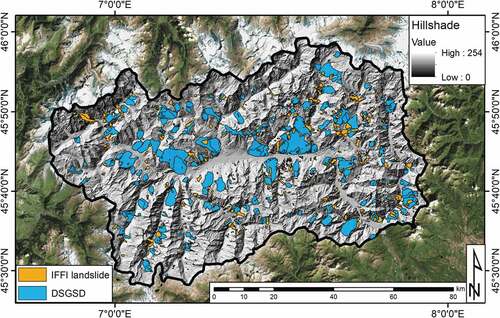
Figure 2. CRI maps for the Valle d’Aosta Region. (a) and (b) are referred to the ascending and descending orbits, respectively. The maps are overlaid on a ESRI World Imagery map
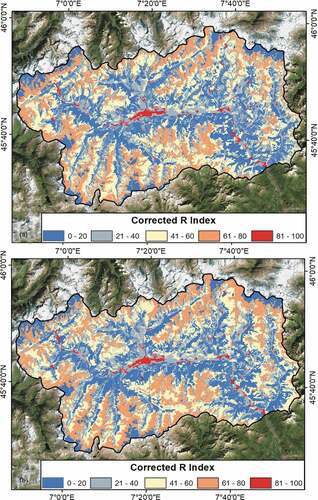
Figure 3. Contingency matrix for the calculation of the interferometric reliability of each moving area. Values ranges between D (not reliable) and A (high reliability)
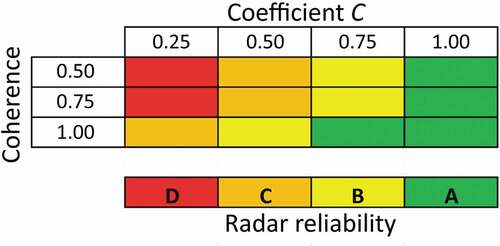
Figure 4. Deformation maps, derived using the SqueeSAR algorithm, for the VdA Region. (a) ascending orbit results, (b) descending orbit results. 1) Punta Chaligne DSGSD; 2) Torgnon DSGSD; 3) Cervinia DSGSD; 4) Emarese DSGSD; 5) Valgrisenche Valley; 6) Cogne Valley; 7) Rhêmes Valley; 8) Valsavarenche Valley. The maps are overlaid on a ESRI World Imagery map
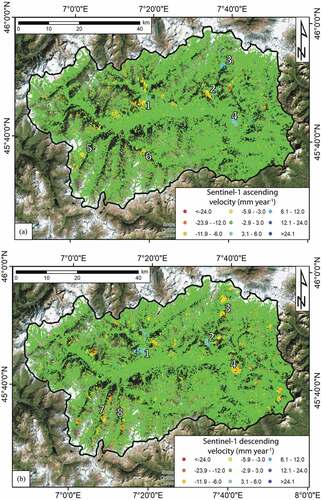
Figure 5. Moving areas above the 10 mm year–1 threshold. The black contours represent the borders of VdA municipalities. The hillshade is derived from a 10 m resolution DEM of VdA. 1) Bosmatto landslide; 2) Allesaz landslide; 3) Ayas municipality; 4) Saint Rhémy En Bosses municipality. The data are overlaid on a ESRI World Imagery map
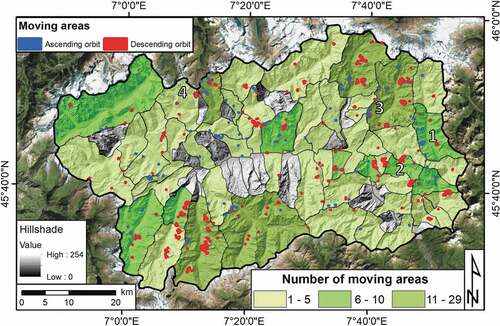
Figure 6. Moving areas falling within the contour of already mapped landslides. The Sentinel-1-derived PS points are represented as triangles with downward orientation if the orbit is descending, upward if it is ascending. Red and blue contours represent moving areas in descending and ascending orbits, respectively. (a) Bosmatto landslide; (b) Allesaz landslides; (c) average time series of deformation for the sectors indicated by yellow rectangles
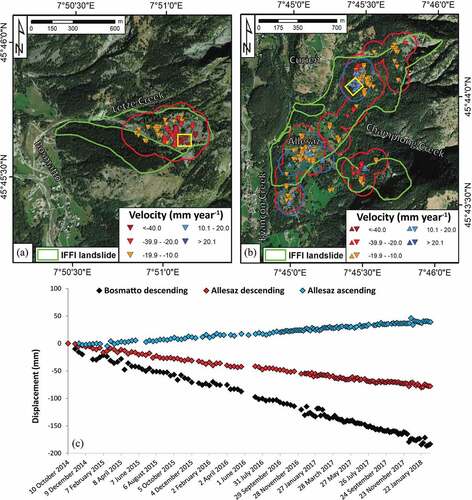
Figure 7. Horizontal (a) and vertical (b) components for the Allesaz landslide
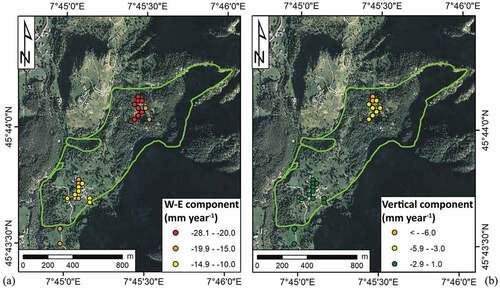
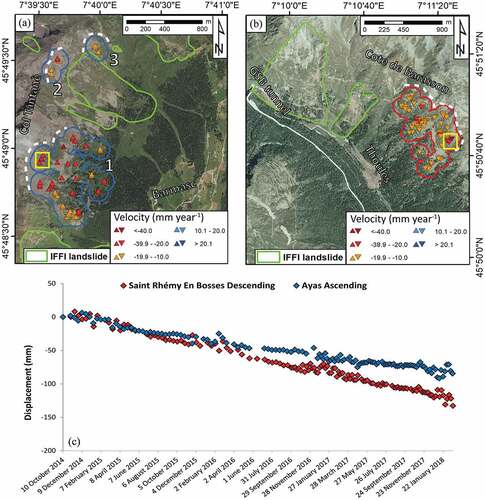
Figure 8. Moving areas falling outside the contours of already mapped landslides. The Sentinel-1-derived PS points are represented as triangles with downward orientation if the orbit is descending, upward if it is ascending. Red and blue contours represent moving areas in descending and ascending orbits, respectively. The white dashed lines represent possible landslide crowns traced on the basis of terrain morphology and PS data. Two examples from the Ayas (a) and Saint Rhémy En Bosses (b) municipalities are reported. (c) average time series of deformation for the sectors indicated by yellow rectangles