Figures & data
Figure 1. Location of study area and distribution of meteorological stations.
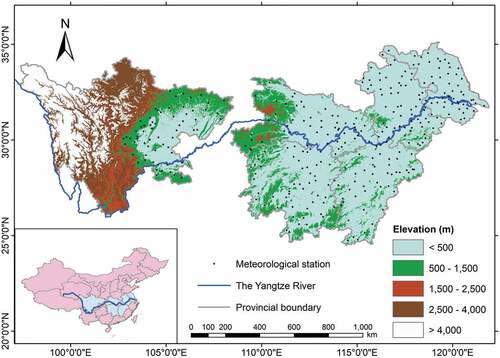
Figure 2. Methodological approach used in the current study.
Figure 3. Regression between daily mean air temperature and MODIS LST for model calibration. TD (a), TN (b), AD (c), AN (d) represent Terra Day time LST, Terra Night time LST, Aqua Daytime LST and Aqua Night time LST, respectively. N represents the sample number.
Figure 4. Validation of daily mean air temperature and daily maximum temperature estimated from MODIS LST (a) observed and estimated
using both Terra and Aqua nighttime LST, and (b) observed
and estimated
using TVX.
Table 1. Statistics of paddy rice cultivated area along the Yangtze River in 2013.
Figure 5. Rice cultivated area in the study area in 2013 estimated using MODIS data.
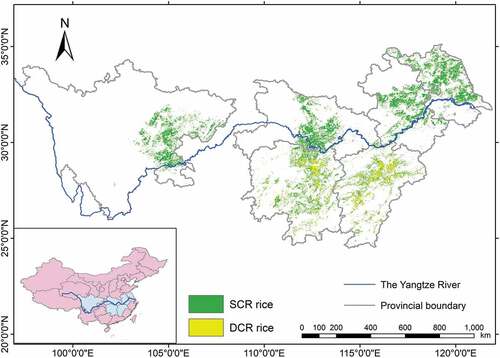
Table 2. Estimated high temperature damaged area of paddy rice in 2013 based on MODIS data.
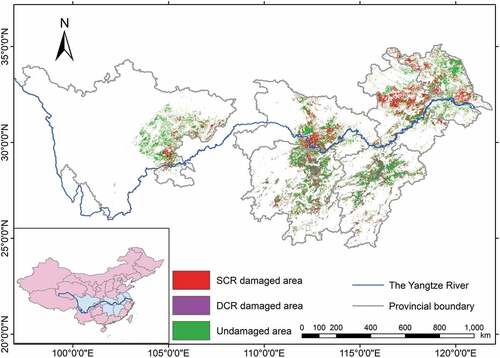
Figure 6. High temperature damaged area of paddy rice in the study area in 2013.