Figures & data
Figure 1. (a) Map of Thailand, (b) Phuket Island in southern Thailand and (c) the area of Thalang district.
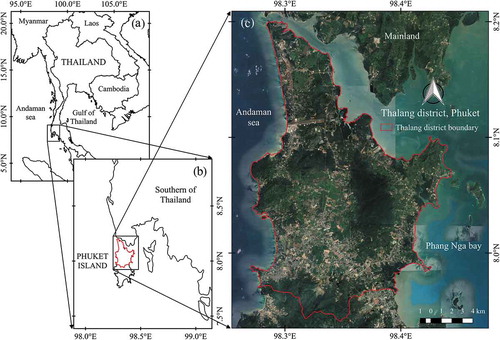
Figure 2. Acquisition dates of the 129 Landsat TM, ETM+ and OLI images.
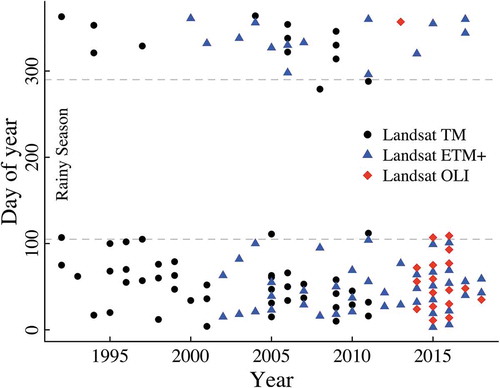
Figure 3. Flowchart of methodology.
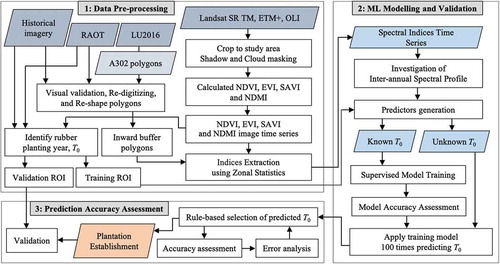
Figure 4. Inter-annual NDVI profile of example (a) intercropping lowland plantation and (e) highland plantation. The high resolution images from GoogleEarthTM show three phases of lowland plantation when (b) before land clearance year (8 January 2004), (c) at year of land clearance (23 February 2009), and (d) after the year of land clearance (28 January 2014). Also the three-phase aerial images of highland plantation at (f) 14 September 2002, (g) 8 January 2004, and (h) 23 February 2009.
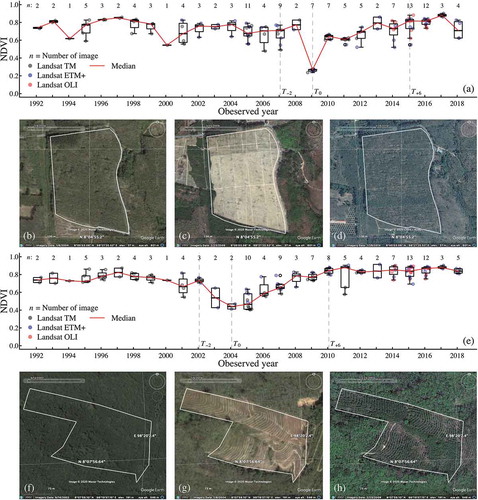
Figure 5. Comparison of inter-annual NDVI profiles for 30 sample lowland and highland plantations during two years before rubber tree planting (T−2 to T−1), the year of rubber planting (T0), and the growing period (T+1 to T+6).
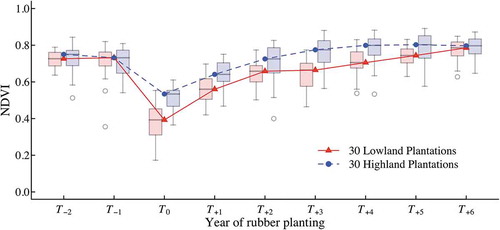
Table 1. Statistical information for the slope coefficient of spectral indices values during the first six years of non-productive phase in 30 sample lowland rubber plantations.
Figure 6. The 30 times performance sensibility test on various sets of predictors varies by five complexity parameters for (a) lowland and (b) highland datasets. And the frequency of utilized predictors in sensibility tests in case of using (c) only NDVI and (d) all indices for lowland dataset, and (e) only NDVI and (f) all indices for highland dataset.
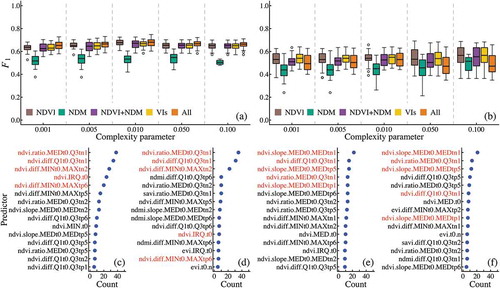
Table 2. Summary result of model training and predicting and their performances for both lowland and highland datasets.
Figure 7. (a) The map of predicted age of rubber plantations in the study area, and (b) the map of result’s confidence by the percentage of nominated T0.
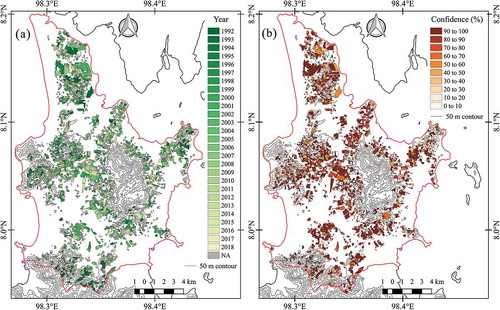
Figure 8. Accuracy assessment of the predicted rubber plantation establishment year with 645 validated ROIs: (a) the scatter plot of the predicted against observed establishment year of rubber plantations, (b) error bar plot of mean predicted against observed establishment year of rubber plantations, and (c) the positive and negative errors of predicted establishment year (predicted T0 – observed T0). ‘NA’ indicates the number of underprediction in particular years.
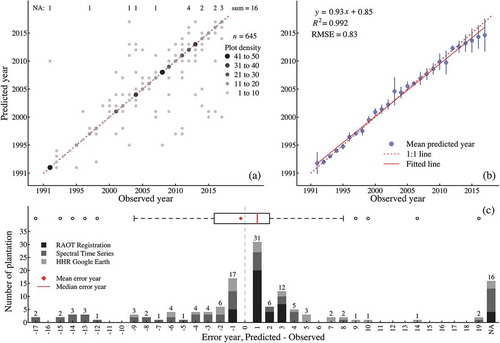
Figure 9. Comparison of example decision trees from RP model training using complexity parameter as (a) 0.05 and (b) 0.03.