
Figures & data
Figure 1. SegNet architecture
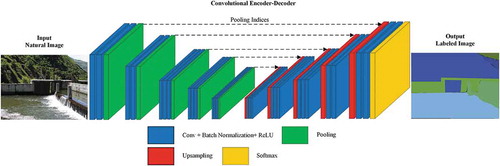
Figure 2. DUpsampling operation
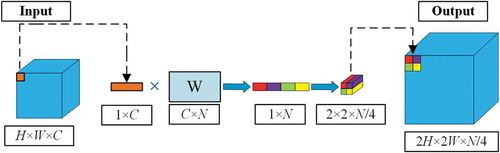
Figure 3. Overview of proposed framework
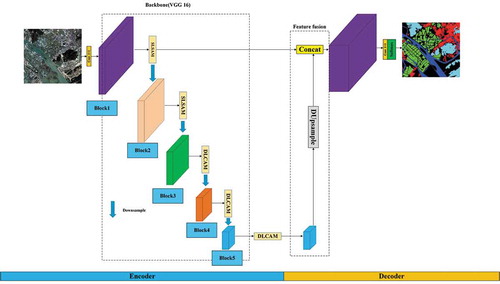
Figure 4. Details of SLSAM
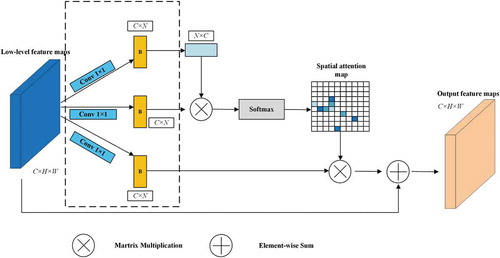
Figure 5. Details of DLCAM
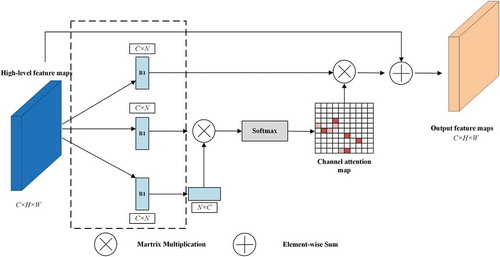
Figure 6. Illustration of focal loss
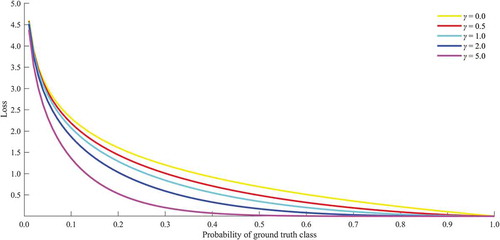
Table 1. GID dataset
Figure 7. Examples of GID-C dataset, (a) Original image, (b) Ground truth
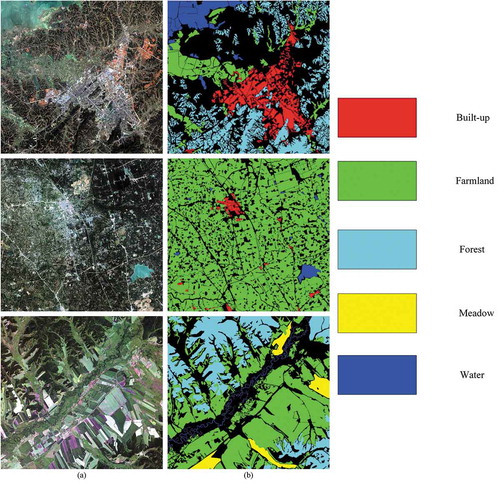
Figure 8. Examples of GID-E dataset, (a) Original image, (b) Ground truth
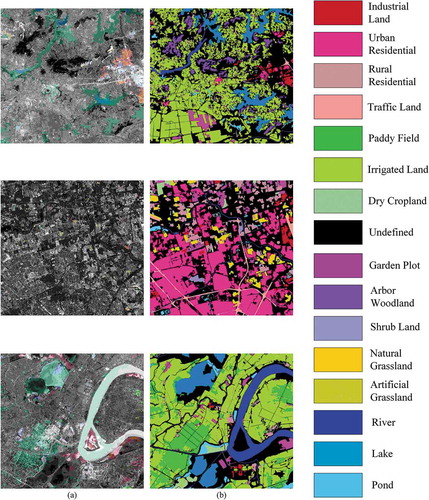
Table 2. Settings of hyper-parameters
Table 3. Numerical evaluation on GID-C (%)
Figure 9. Results on GID-C test set, (a) Original image, (b) Ground truth, (c) SegNet, (d) U-Net, (e) ResUNet-a, (f) SCAttNet, (g) Ours
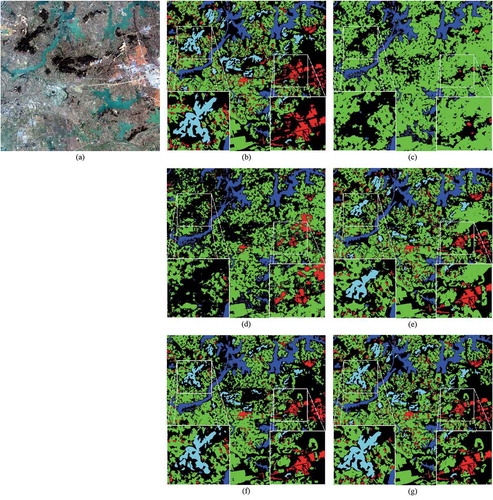
Table 4. Numerical evaluation on GID-E (%)
Figure 10. Results on GID-E test set, (a) Original image, (b) Ground truth, (c) SegNet, (d) U-Net, (e) ResUNet-a, (f) SCAttNet, (g) Ours
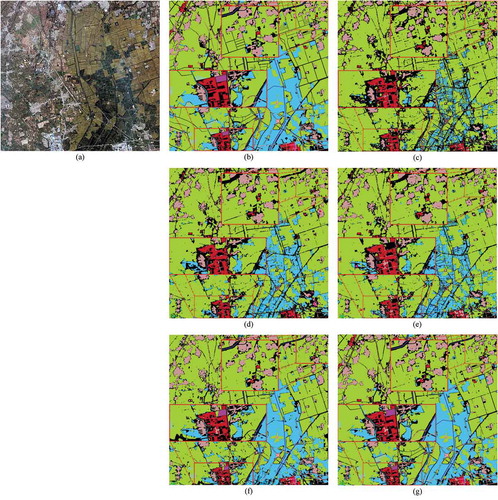
Figure 11. Training loss with different architecture
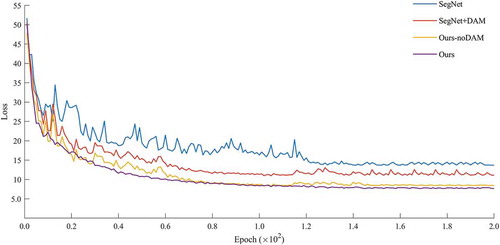
Figure 12. Training accuracy with different loss function
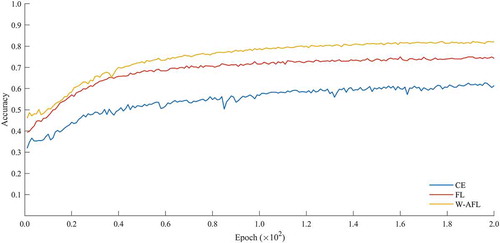
Table 5. Execution time comparison
Table 6. Training time per epoch (×103 s)
Table A1. Class-wise IoU of GID-C test set (%)
Table B1. Class-wise IoU of GID-E test set (%)