Figures & data
Figure 1. Conceptual flow chart of DIM approach used to estimate phytoplankton carbon fixation from lakes. Cylinders represent input data, rectangles are algorithms/calculations, and ovals are data outputs
Table 1. Data used to generate the latitude vs. light utilization index model. The reference for each lake study and the continent is shown on the table
Table 2. Independent data used to validate the DIM model. The mean values for in situ observations and DIM retrievals are shown on the table
Table 3. Ranges of the light utilization index (ψ), photic zone integrated chlorophyll, water column primary production, irradiance, and the number of lakes for each three degree latitude bin used in the model to estimate ψ from latitude
Figure 2. Relationship of light utilization index (ψ) and latitude for global freshwater lakes during the growing season bin averaged by 3°. The decreasing linear relationship between latitude and ψ was significant (p value = 0.001, R2 = 0.57)
Figure 3. Mean growing season areal carbon fixation (mg C m−2 day−1) in freshwater lakes aggregated by freshwater ecoregions of the world (Abell et al. Citation2008)
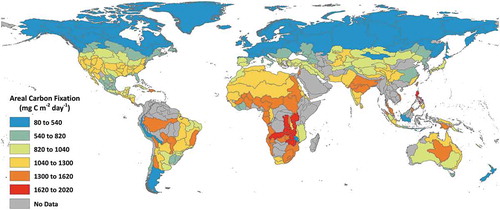
Figure 4. Areal carbon fixation (mg C m−2 day−1) aggregated by freshwater ecoregions of the world vs. latitude for northern (y = −13.479 x + 1279.3, R2 = 0.45, p < 0.001, N = 217 and southern hemispheres (y = −14.781 x + 1227.1, R2 = 0.26, p = 0.046, N = 16)
Figure 5. Mean continental growing season areal carbon fixation (mg C m−2 day−1)
Figure 6. Log–log plots of individual lake area and areal carbon fixation for all 80,000 lakes grouped by hemisphere (northern (a), southern (b))
Figure 7. Total continental growing season carbon fixation (Tg C day−1)
Figure 8. Total carbon fixation (Tg C day−1) from freshwater lakes aggregated by freshwater ecoregions of the world (Abell et al. Citation2008)
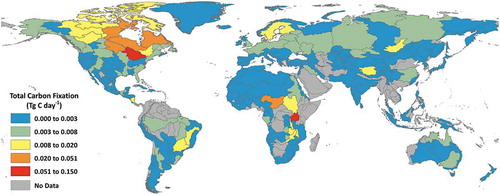
Figure 9. Log–log plots of total lake surface area and total carbon fixation for lakes aggregated by freshwater ecoregions of the world. Data points are coloured by groups (Red: N 0°–30°, Yellow: N 30°–60°, Green: N > 60°, Blue: S 0– 30°, Purple: S 30°–60°)
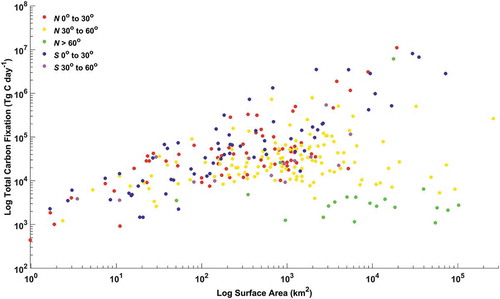
Figure 10. Log-log plots of individual lake area and total carbon fixation for all 80,000 lakes grouped by hemisphere (northern (a), southern (b))