Figures & data
Figure 1. Spatial distribution of selected sites of e CERN
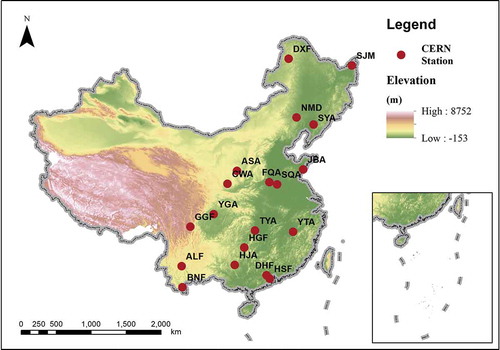
Figure 2. The structure of an ordinary DBN and diagram of a restricted Boltzmann machine. (a) A simple structure of a DBN; (b) A simple structure of a RBM
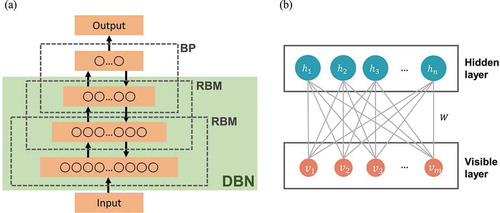
Table 1. Characteristics of LUT for a clear sky
Table 2. Characteristics of LUT for a cloudy sky: both for water cloud and ice cloud
Figure 3. The flow chart for the whole estimate
Figure 4. (a) Sensitivity of GHI to SZA: Clear: AOT = 0.1, SA = 0.1; Water cloud: COT = 10, CER = 8 μm, SA = 0.1; Ice cloud: COT = 10, CER = 32 μm, SA = 0.1; (b) Sensitivity of GHI to AOT: SA = 0.1; (c) Sensitivity of GHI to CTWV: AOT = 0.1, SA = 0.1; (d) Sensitivity of GHI to COT: Water cloud: SZA = 30°, CER = 8 μm, SA = 0.1; Ice cloud: SZA = 30°, CER = 32 μm, SA = 0.1; (e) Sensitivity of GHI to CER: Water cloud: SZA = 30°, COT = 10,SA = 0.1; Ice cloud: SZA = 30°, COT = 10, SA = 0.1 (f). Sensitivity of GHI to SA: Clear: SZA = 30°, AOT = 0.1; Water cloud: COT = 10, CER = 8 μm, Ag = 0.1; Ice cloud: COT = 10, CER = 32 μm
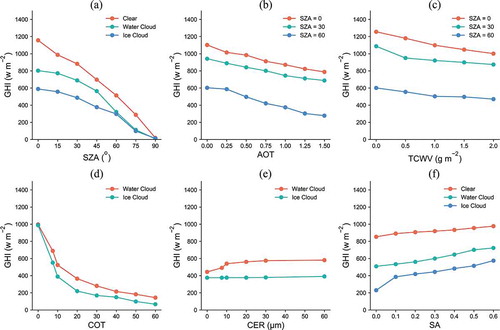
Figure 5. Comparison of the normalized calculation efficiency of different methods (SBDART results is set as a baseline. Xeon (R) E5-2640 processor and RAM 16 GB)
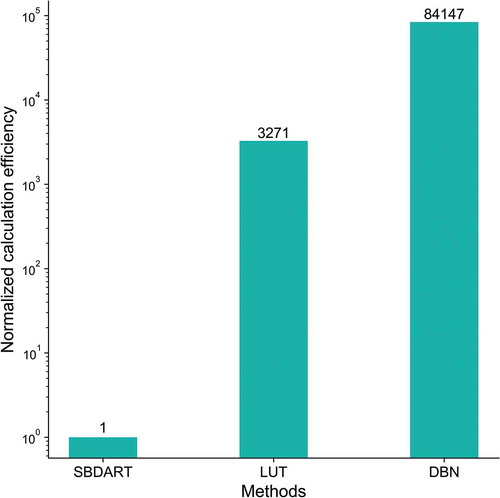
Figure 6. Estimated GHI (w m−2) at 03:00 UTC on chosen days: (a) 21 August 2018; (b) 25 August 2018; (c) 1 November 2018; (d) 4 November 2018
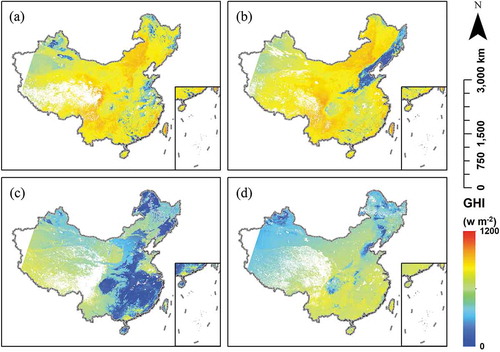
Figure 7. Estimated GHI (w m−2) at 06:00 UTC on chosen days: (a) 21 August 2018; (b) 25 August 2018; (c) 1 November 2018; (d) 4 November 2018
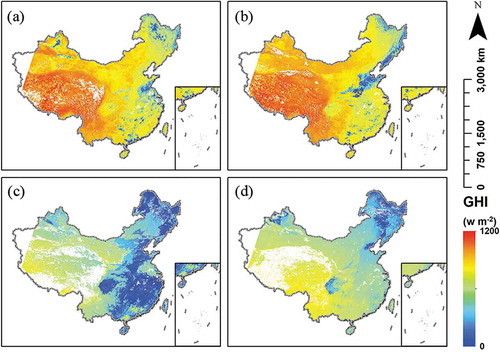
Figure 8. Real colour images from Himawari-8 at 03:00 UTC on chosen days: (a) 21 August 2018; (b) 25 August 2018; (c) 1 November 2018; (d) 4 November 2018
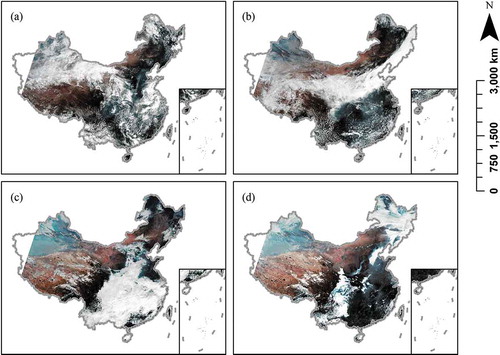
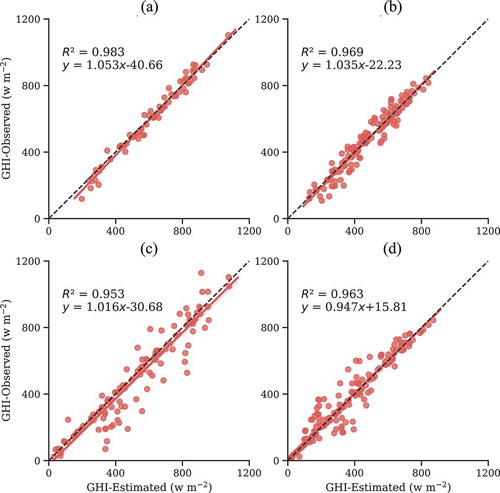
Table 3. Summary statistics of the validation results
Figure 9. Validation results at the chosen CERN sites over China: summer clear case is on upper left; winter clear case is on upper right; summer cloud case is located on bottom left; winter cloud case is located on bottom right. (a) If cloud = No & Season = Summer; (b) If cloud = No & Season = Winter; (c) If cloud = Yes & Season = Summer; (d) If cloud = Yes & Season = Winter. Note that subfigures (a) and (b) share the same y-axis lables, as well as (c) and (d). And (a) and (c), (b) and (d) share the same x-axis labels respectively