
Figures & data
Figure 1. Study area and experimental design. Field site at the Field Research Centre of Crops for the Future in Semenyih, Malaysia. Experimental layout of plots as shown in aerial photo mosaic RGB in bird’s-eye view taken at a height of 10 meters on 22 June 2018 at flowering stage using the integrated DJI Phantom 4 Pro camera. B1G1R1 means; plot is in block 1, genotype is genotype 1 and replicate is the first replicate.
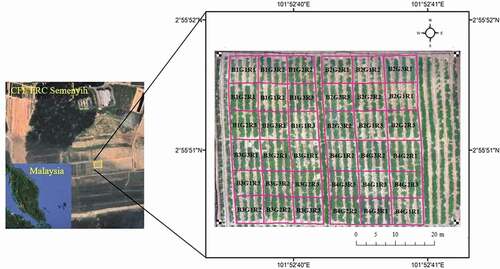
Table 1. Remote sensing and proximal sensing data acquisition during Bambara groundnut growing season in 2018
Figure 2. Image processing workflow and proposed method for estimating Bambara groundnut yield using the low cost UAV imaging system.
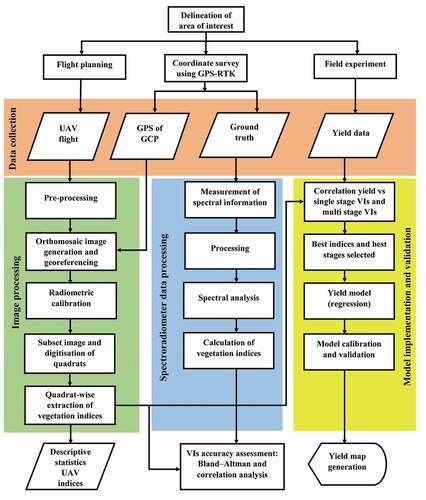
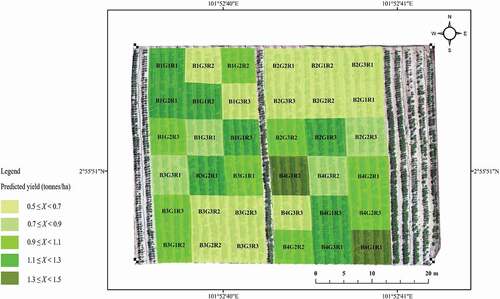
Figure 3. Spatial variability of Bambara groundnut yield and the productivity of different plots within one field. The value ranges of yield are presented according to the four quartiles.
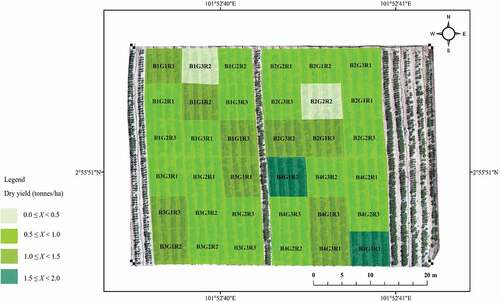
Table 2. Descriptive statistics of the UAV based spectral VIs at different crop stages for 2018 Bambara groundnut growing season
Table 3. Correlation coefficients between VIs extracted from remote sensing UAV imagery data (UAV) and proximal sensing BER values derived from data acquired by the spectroradiometer (gt)
Figure 4. Scatterplots indicate the linear relationship between the indices derived from data acquired by Canon S100 and BER indices derived from data acquired by spectroradiometer; (a) NDVI, (b) EVI2, (c) SR, and (d) GNDVI.
Figure 5. Bland–Altman plots comparing VIs calculated from data acquired by UAV based Canon S100 multispectral images and BER indices derived from data acquired by Spectroradiometer; (a) NDVI, (b) EVI2, (c) SR, and (d) GNDVI. Blue dots are individual random samples; black solid lines indicate mean bias and red solid lines indicate the upper and lower limits of agreement.
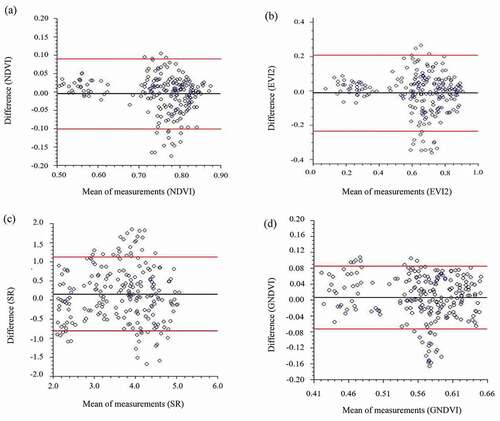
Table 4. Pearson correlation coefficients between Bambara groundnut dry seed yield and spectral VIs at different growth stages
Figure 6. Correlation of Bambara groundnut yield with the cumulative VIs from vegetative stage to senescence stage.
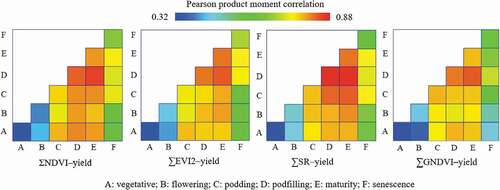
Table 5. Quantitative relationships between yield (y) and spectral VIs (x) in Bambara groundnut for 2018 growing season
Figure 7. (a) Relationship between yield and ∑SR from podfilling to maturity stage; (b) Correlation between predicted field-scale yield estimated by regression model developed and observed field yield using independent validation (test) data set.
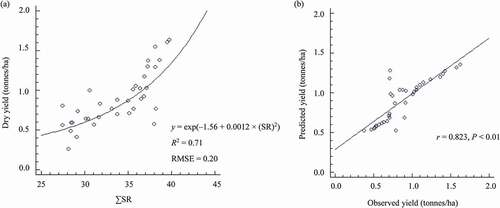
Table 6. Predicted yield versus observed yield for the growing season
Figure 8. Map of predicted Bambara groundnut yield expressed as dry seed weight in tonnes/ha.
supplemental_figure_1.docx
Download MS Word (554.5 KB)Supplementary_materials_IJRS_drone_first_look.docx
Download MS Word (2.6 MB)Figure_captions_IJRS_drone.docx
Download MS Word (12.8 KB)Table_captions_IJRS_Drone.docx
Download MS Word (12.2 KB)Data availability statement
The data that support the findings of this study are available from the corresponding author, [A.S.], upon reasonable request by e-mail: [email protected].