Figures & data
Table 1. Summary of the field data used for validation
Figure 1. Overview of the segmentation algorithms using templates (i.e. tree crown density models).
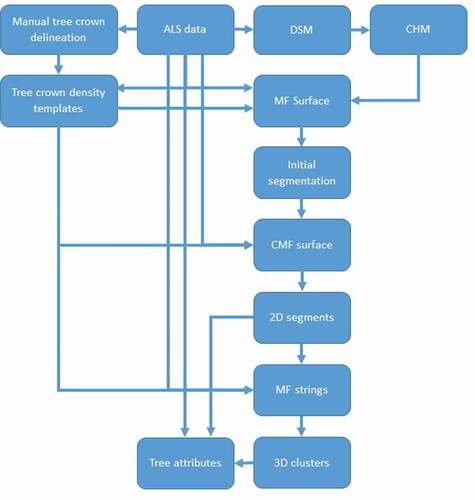
Table 2. Algorithm summary
Figure 2. The templates created in the training phase using low-altitude ALS data.
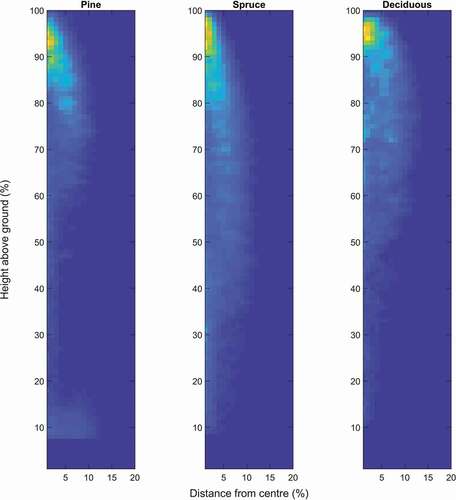
Figure 3. (a) Model fit (MF) strings with colors set by the model fit coefficient (B value) and gray points showing the original point cloud, (b) the original point cloud with colors set by the identification numbers of 3D segments. the original point cloud was selected using a polygon obtained from 2D segmentation using high-altitude ALS data.
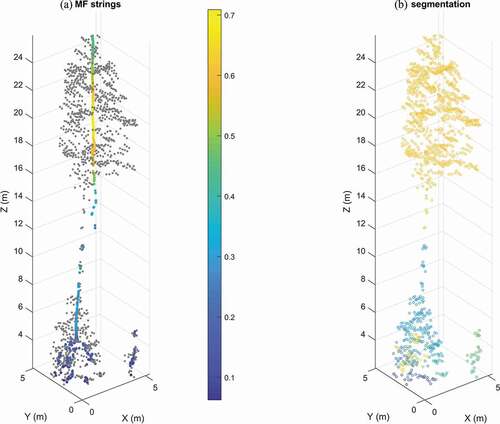
Figure 4. DSM with 0.05 m resolution as the background image, and tree crown segments from the 2D segmentation algorithm using ALS data from low altitude (150 m above ground level) as the input. Field measured tree positions shown as yellow dots. the boundary of the field plot (80 m diameter) is shown with a green circle.
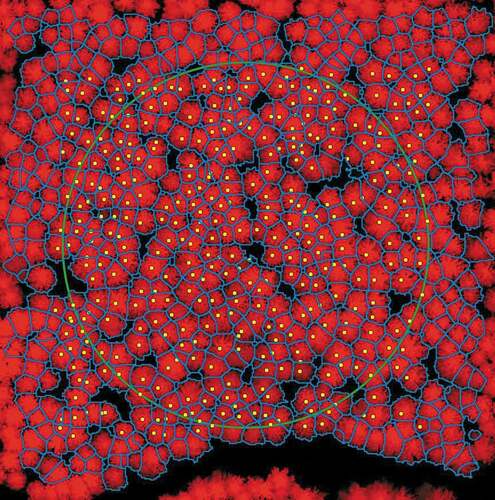
Figure 5. Clustering of 3D point cloud produced from high-altitude ALS data (1450 m above ground level).
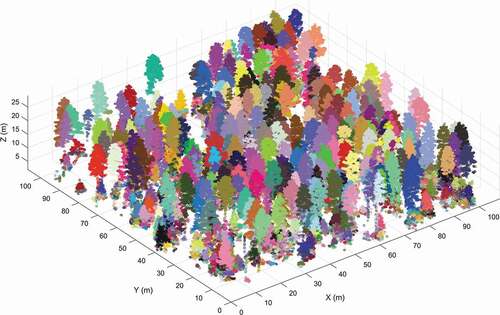
Figure 6. Histograms showing tree detection results from 2D segmentation using high-altitude ALS data (white bars for all field trees and gray bars for field trees that were linked to trees detected in the ALS data).
Figure 7. Histograms showing tree detection results from 2D segmentation using low-altitude ALS data (white bars for all field trees and gray bars for field trees that were linked to tree detected in the ALS data).
Figure 8. Histograms showing 3D segmentation tree detection results using high-altitude ALS data (white bars for all field trees and gray bars for field trees that were linked to tree detected in the ALS data).
Figure 9. Histograms showing 3D segmentation tree detection results using low-altitude ALS data (white bars for all field trees and gray bars for field trees that were linked to tree detected in the ALS data).
Table 3. Results from tree detection using 2D segmentation and high-altitude ALS data: omission errors affect (in percentage) on the number of trees (Number), on the basal area (Basal area), and on the stem volume (Volume); commission error (in percentage) of all trees and of only tall trees (ALS tree height >10 m)
Table 4. Results from tree detection using 2D segmentation and low-altitude ALS data: omission errors affect (in percentage) on the number of trees (Number), on the basal area (Basal area), and on the stem volume (Volume); commission error (in percentage) of all trees and of only tall trees (ALS tree height >10 m)
Table 5. Results from tree detection using 3D segmentation and high-altitude ALS data: omission errors affect (in percentage) on the number of trees (Number), on the basal area (Basal area), and on the stem volume (Volume); commission error (in percentage) of all trees and of only tall trees (ALS tree height >10 m)
Table 6. Results from tree detection using 3D segmentation and low-altitude ALS data: omission errors affect (in percentage) on the number of trees (Number), on the basal area (Basal area), and on the stem volume (Volume); commission error (in percentage) of all trees and of only tall trees (ALS tree height >10 m)
Table 7. Mean values of plot results from tree detection using 2D segmentation and low-altitude ALS data: omission errors affect (in percentage) on the number of trees (number), on the basal area (basal area), and on the stem volume (volume); commission error (in percentage) of all trees and of only tall trees (ALS tree height >10 m)
Figure 10. Stem volume for all trees and for detected trees using high-altitude 2D segmentation in stem diameter intervals on all field plots.
Figure 11. Stem volume for all trees and for detected trees using low-altitude 2D segmentation in stem diameter intervals on all field plots.

Figure 12. Stem volume for all trees and for detected trees using high-altitude 3D segmentation in stem diameter intervals on all field plots.
Figure 13. Stem volume for all trees and for detected trees using low-altitude 3D segmentation in stem diameter intervals on all field plots.
Figure 14. Tree heights from high-altitude ALS data (1450 m above ground level) and tree heights from low-altitude ALS data (150 m above ground level) for automatically connected trees on 10 sample plots (2200 linked trees), coefficient of determination (R2), standard deviation of differences (STD) and mean value of differences (Bias).
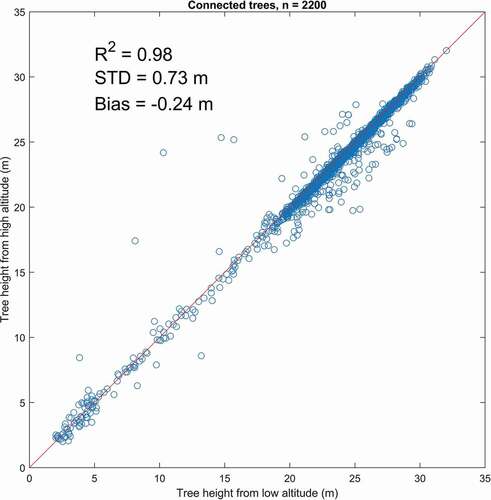
Figure 15. Tree heights from individual trees obtained from high-altitude ALS data (1450 m above ground level) and field-measured trees (214 linked trees), coefficient of determination (R2), standard deviation of differences (STD) and mean value of differences (Bias).
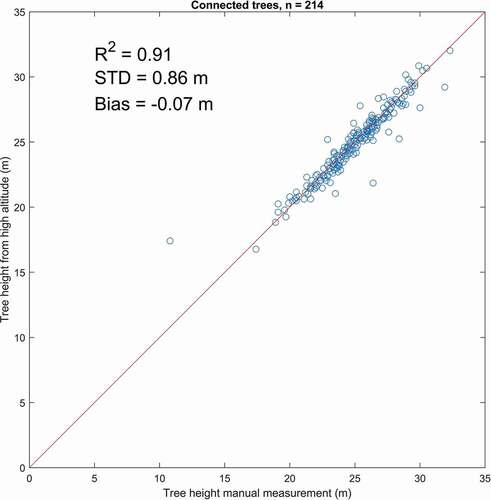
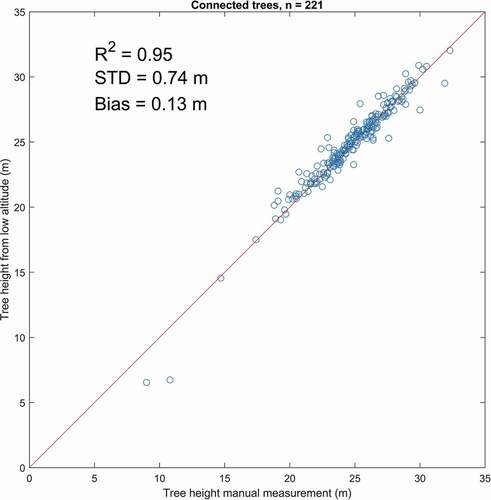
Figure 16. Tree heights for individual trees obtained from a helicopter at low altitude (150 m above ground level) and field-measured trees (221 linked trees), coefficient of determination (R2), standard deviation of differences (STD) and mean value of differences (Bias).