
Figures & data
Table 1. Spread rate thresholds from selected studies
Figure 1. 95th percentile fire size calculated with temporal parameters of 2-days and 14-days using the standard flood-fill algorithm implementation. Note that fire size increases monotonically as the temporal parameter representing the threshold of cell-to-cell spread (in days) also increases.
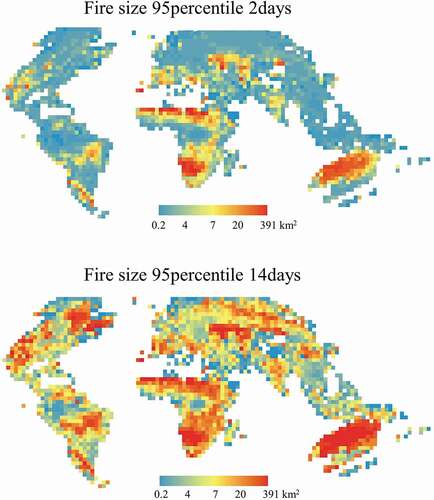
Figure 2. Proposed application of CRoS metric to burn patch extraction. (a) all available MCD14ML active fire locations are used as input to the (b) DBSCAN clustering and (c) fire spread tracking phases (see for additional details). (d) summary metrics, e.g., median CRoS (?), are calculate for each combination of Biomes-per-Realms and tree-cover category and converted into e) spatially explicit cell-to-cell ?-thresholds used to control f) flood-fill algorithms for individual burn patch extraction.
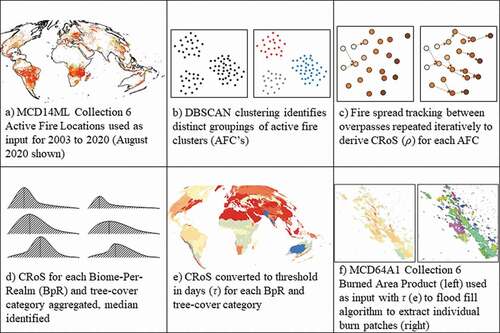
Figure 3. Illustration of the DBSCAN clustering and fire tracking approaches, with successive algorithm steps shown from left to right. Panel A shows two patches of MODIS fire pixels prior to clustering and tracking. Two fire clusters (orange and blue) are identified in panel B. MCD14ML detections from the first overpass are identified in each cluster in panel C the spread is “tracked,” assuming spread to the spread to the nearest (spatiotemporal) neighbour in subsequent overpasses. The spread tracking is repeated iteratively until no more neighbours are found within the spatiotemporal search radius.
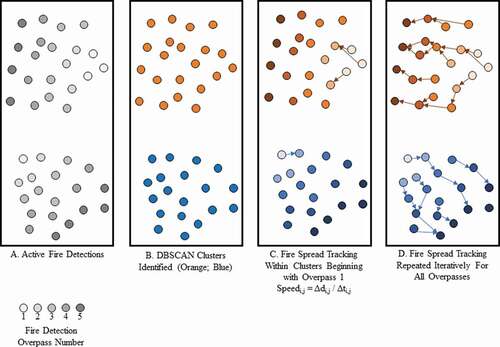
Table 2. Fire boundary data from external sources
Figure 4. Number of MODIS observations (Aqua and Terra) on 1 July 2020, derived from the MOD09GA and MYD09GA products. White indicates regions with no observations.
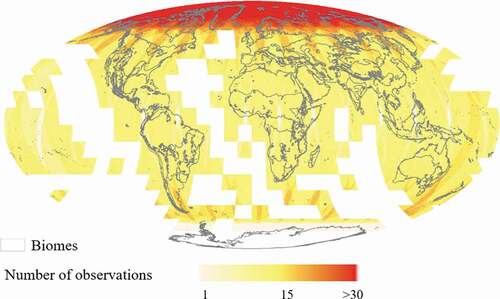
Figure 5. Median CRoS in areas with fire activity (>0.005 active fires km-1 yr-1) masked by (a) forest (>=90% tree cover), (b) mixed (tree cover >10% and <90%), and non-forested (<=10% tree cover) land covers. Only ecoregions with >0.05% mean annual burned area are shown, determined using the MCD64A1 Collection 6 Burned Area Product (Giglio et al. Citation2018).
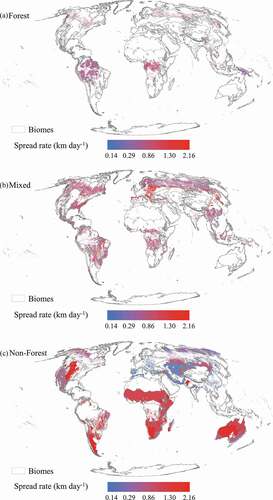
Table 3. CRoS (ρ; km day-1) per biome disaggregated by forested (≥90% tree cover), mixed (10≥% tree cover <90), and non-forested (<10% tree cover) land covers. Agricultural fires excluded (>10% fires in agricultural land covers). Biomes with <30 fire clusters excluded
Figure 6. Histogram of fire speeds in forested (top), mixed (middle), and non-forested (bottom) land covers.
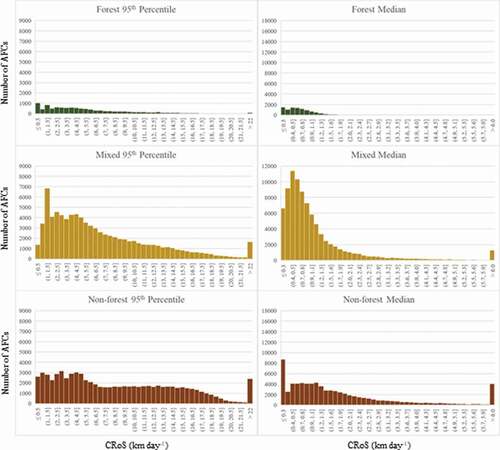
Figure 7. Burn patch extraction examples for two scenes in 2015 from Kazakhstan (top row) and Australia (bottom row). Boxes (a) and (d) show the input MCD64A1 Collection 6 burned area product, boxes (b) and (e) show the Fire Atlas “perimeters” dataset for comparison, and boxes (c) and (f) illustrate the result of burn patch identification using the proposed CRoS threshold approach. For the Fire Atlas and CRoS-derived patches, each unique colour represents a distinct burn patch.
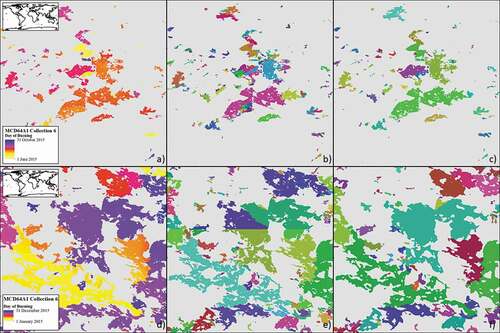
Figure 8. Mean number of burn patches identified per year for a range of threshold values (?) between 2001 and 2020. The CRoS-based parameter is implemented at the BpR unit for the forest/mixed/non-forest cover types and adjusted for displacement of the sinusoidal projection using the haversine transformation, with results aggregated to the realm unit.
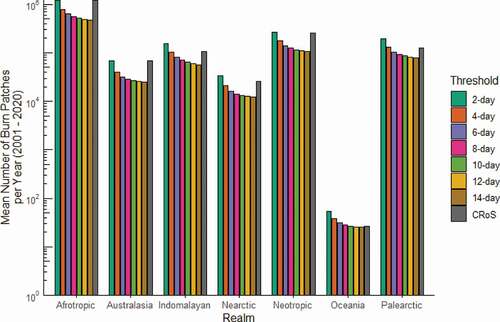
Figure 9. Box plots of the percent of active fire locations correctly identified by AFCs compared to reference datasets. The sample size for each dataset can be found in .
Table 4. Accuracy assessment of the rate of spread from the DBSCAN clustering method and reference fire boundaries
Figure 10. Scatterplot of the median spread rate of individual fires for reference and observed AFCs.
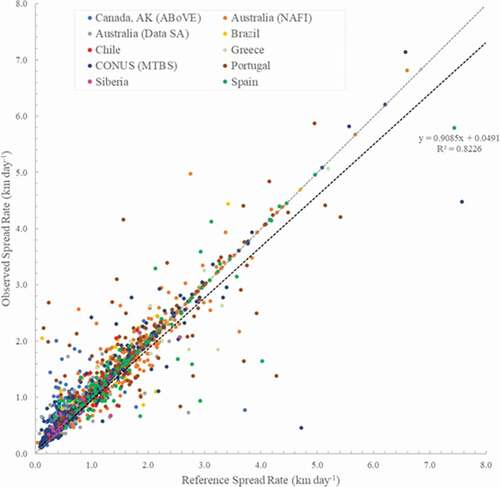
Figure S1. Realms and biomes defined in the Ecoregions 2017 (Dinerstein et al., 2017) classification.
Download JPEG Image (869.1 KB)
Data availability statement
The data that support the findings of this study are available from the corresponding author, M.H., upon reasonable request.