
Figures & data
Figure 1. Location of the fire-affected area and associated terrain. the Orroral Valley Fire is designated as the burnt area within the ACT. the majority of the fire area burned from 27 January to 17 February 2020.
Figure 2. Example of quality control assessment of two aerial Modified CBI estimates. (a – b) shows a location where visual assessment of fire severity aligns between (a) the 10 cm UAV imagery, (b) adjacent close-range aerial geolocated photograph, and the respective recorded MCBI score (MCBI = 1.33), with all sources indicating lower severity understorey fire. (c – d) shows a location where the assessments do not align between (c) the UAV imagery which indicates green and partially intact canopy, (d) aerial photography which indicates a scorched canopy, and the respective MCBI score (MCBI = 2.50). in the latter case, fine-scale heterogeneity in fire severity caused assessment differences.
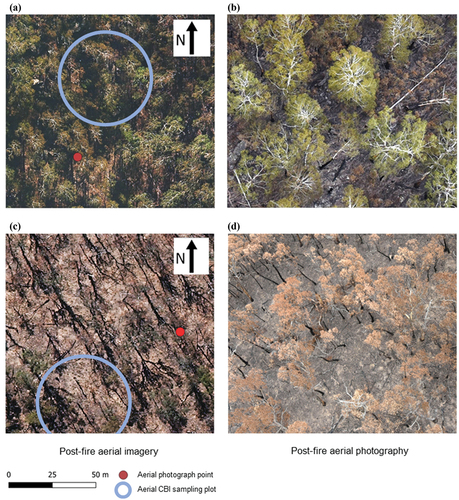
Figure 3. Conceptual illustration of the VSPI (Massetti et al. Citation2019). A given pre-fire SWIR reflectance pair (Apre-fire, coloured grey) is displaced in spectral space along the dashed vector to post-fire point (Apost-fire, coloured red), with the perpendicular distance (VSPIA) to the pre-fire vegetation line representing fire severity.
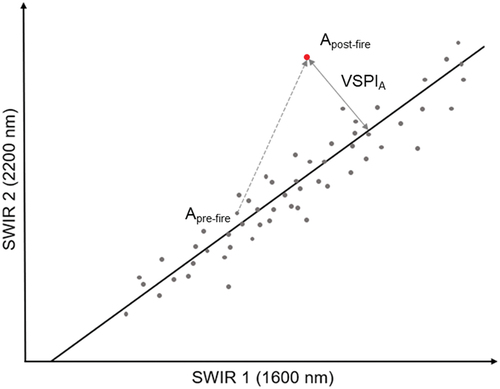
Table 1. Airborne LiDAR data quality information
Figure 4. Demonstration of PAC (Hu et al. Citation2019) for (a) lower severity and (b) higher severity areas of the Orroral Valley Fire study area. Plots (top) illustrate 2015 and 2020 LiDAR PA curves with the PAC represented by the shaded areas. Aerial images (bottom) show corresponding post-fire areas.
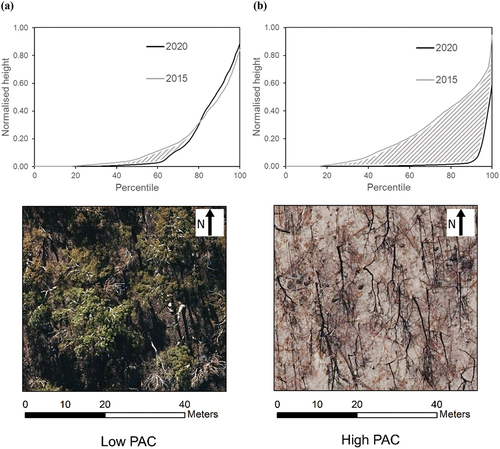
Figure 5. Comparison of correlations between modified CBI and remotely sensed fire severity estimates, indicated by Pearson’s r and Spearman’s ρ coefficients. Points represent modelled coefficients ±95% confidence intervals.
Figure 6. Regression of Modified CBI for the Orroral Valley Fire study area with remotely sensed VSPI, RVSPI, PAC and RPAC via piecewise linear regression, and dNBR, RBR and RdNBR via exponential regression. Displayed regression models are the best-performing models in classification accuracy analyses. Plotted lines represent modelled conditional means ± standard error.
Table 2. Comparison of overall Kappa statistics for remotely sensed fire severity indices using thresholds derived from linear, exponential and piecewise linear regression models. Bold text indicates the most accurately classified model for each remotely sensed index
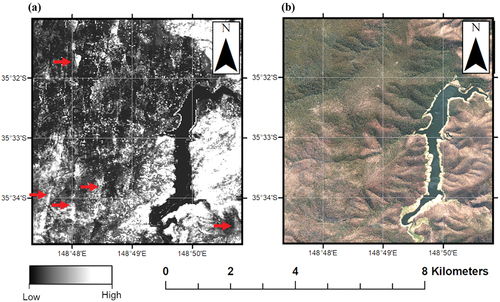
Figure 7. Comparison of (a) PAC estimated fire severity for a section of the Orroral Valley Fire to (b) corresponding post-fire aerial image. Straight line artefacts resembling airborne LiDAR flight paths (indicated by red arrows) are not represented in the post-fire UAV imagery and are likely caused by differences in scan angle between pre- and post-fire acquisitions.
Supplementary_material_3_clean.docx
Download MS Word (31.9 KB)Supplementary_material_2_clean.docx
Download MS Word (275.9 KB)Supplementary_material_1_clean.docx
Download MS Word (737.9 KB)Data availability statement
Some data that support this study were obtained from the ACT EPSDD by permission. This data may be shared upon reasonable request to the corresponding author subject to permission from the ACT EPSDD. Other data that support this study will be shared upon reasonable request to the corresponding author.