
Figures & data
Figure 1. Location and aerial views of Tonzi Ranch and the San Joaquin Experimental Range. Circles and crosses indicate the locations where Digital Hemispherical Photographs (DHP) and leaf collection took place, respectively. Images obtained from Google Maps.
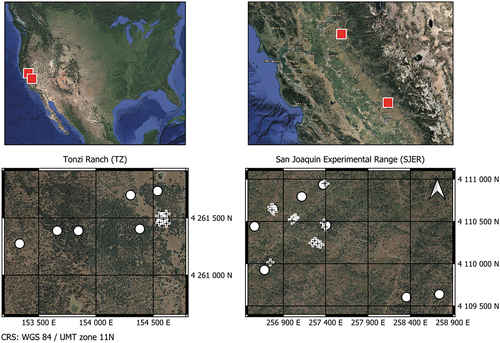
Figure 2. Sampling patterns used for the collection of the DHP over the 60 m 60 m plots.
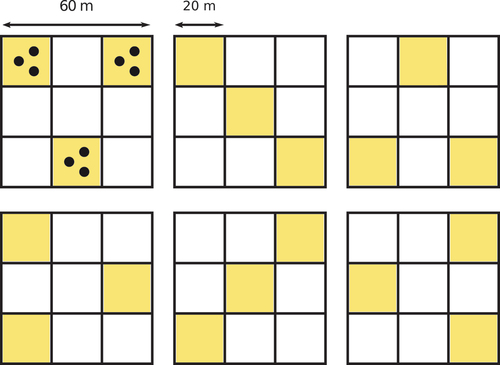
Table 1. Data collected over the study sites for gap fraction and leaf biochemistry and minimum, maximum and average values.
Table 2. Dates (Day of year (DOY)/YY) of the overflights of AVIRIS-C and AVIRIS-NG over the study sites.
Figure 3. Color compositions of the synthetic hyperspectral images over TZ and SJER for June 2014.
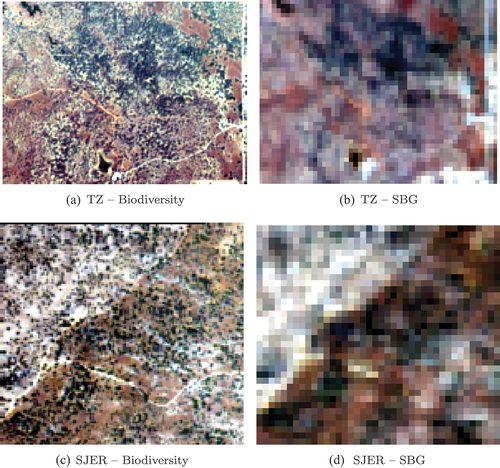
Table 3. Values and ranges used to model the forest scenes within the DART model.
Figure 4. Relationship between Car and C in SJER and TZ for the two broad-leaved species.
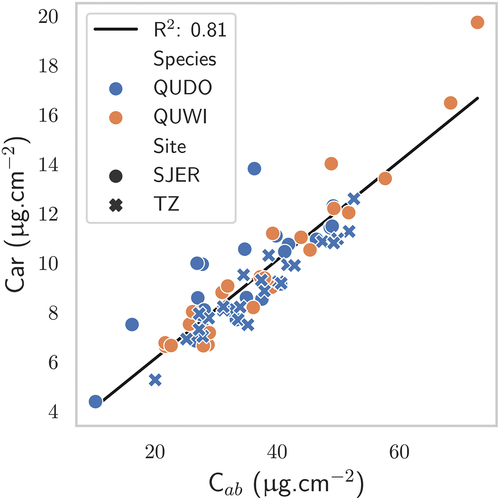
Figure 5. Histograms of the CC of conifers and broad-leaved trees of TZ within the pixels of the hyperspectral images.
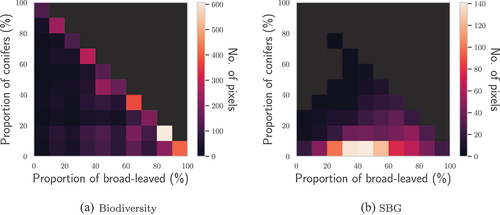
Table 4. Statistics of the bagged PLSR models when predicting the vegetation traits over the train and test databases and over the hyperspectral images.
Figure 6. Comparison between vegetation traits as estimated by the PLSR and the in situ measurements for the AVIRIS-C images: gap fraction, C, Car, EWT, LMA. The hue of the markers depends on the CC of the hyperspectral pixels that were considered. Black markers correspond to zones where CC information was not available.
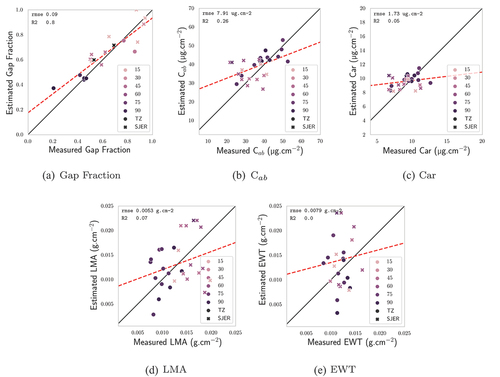
Table 5. Comparison between the values estimated from different sensors over two CC zones of TZ.
Figure 7. Comparison between C estimates from Biodiversity and SBG imagery over TZ. Pixels whose NDVI was lower than those that could be computed from the spectra of the training databases were masked.
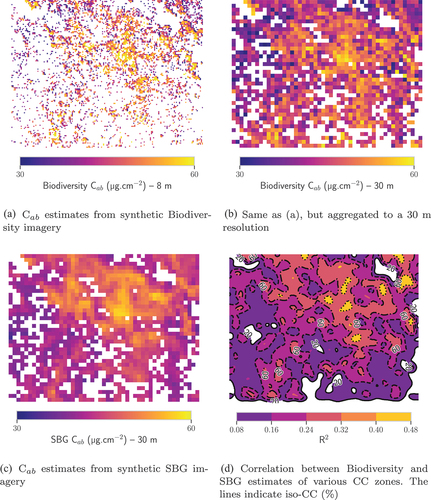
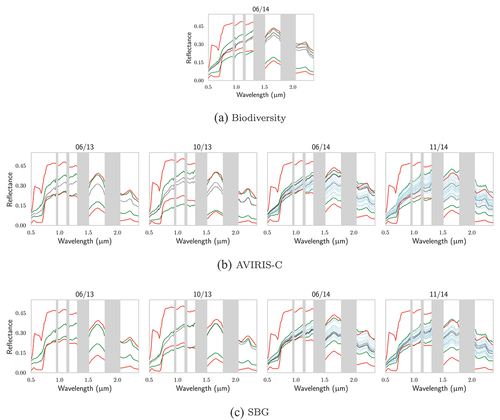
Figure A1. For TZ, comparison of (in red) the extrema of the DART-generated databases for Biodiversity, AVIRIS-C and SBG with: (in green) the extrema of the vegetation pixels of their respective images; the reflectances of the pixels associated with in situ (in black) biochemistry and (in blue) gap fraction measurements.
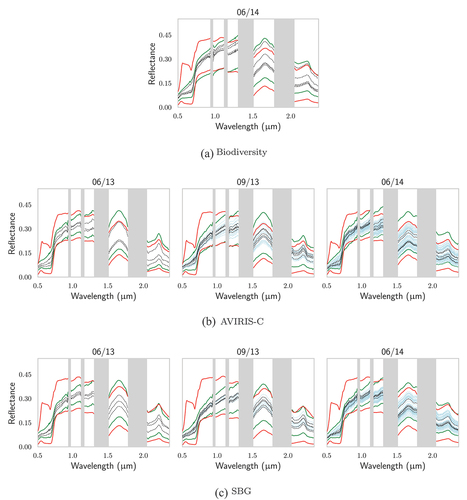
Figure A2. For SJER, comparison of (in red) the extrema of the DART-generated databases for Biodiversity, AVIRIS-C and SBG with: (in green) the extrema of the vegetation pixels of their respective images; the reflectances of the pixels associated with in situ (in black) biochemistry and (in blue) gap fraction measurements.
Data availability statement
The data that support the findings of this study are available on request from the corresponding author, T.M. The data are not publicly available due to company policy.