
Figures & data
Figure 1. Radar backscattering characteristics based on the water level position in peatlands.
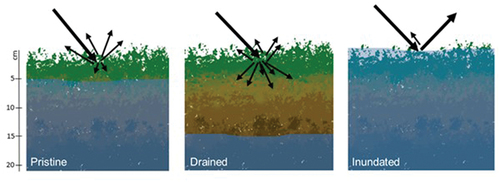
Figure 2. a) Schematic of the radar measurement system and experiment setup. The bog was surrounded on its bottom and sides by a waterproof butyl rubber liner and sat upon a stable bed of dry sand (25 cm deep). b) Photograph of the ‘Bog in the box’ laboratory setup. c) Sphagnum segment, representing predominantly moss vegetation. d) Ericaceous (heather) segment, representing moss layer covered with dwarf-shrub vegetation.
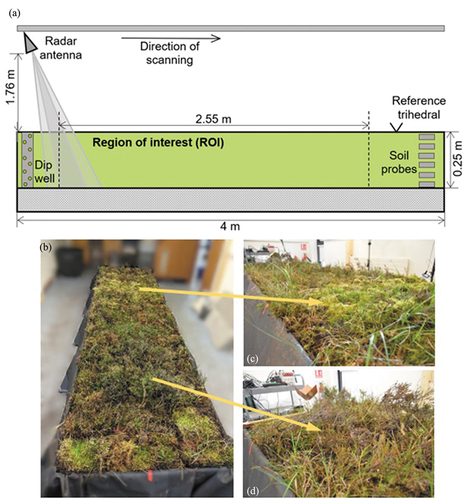
Figure 3. Average, minimum, and maximum air temperatures in the laboratory during the experiment.
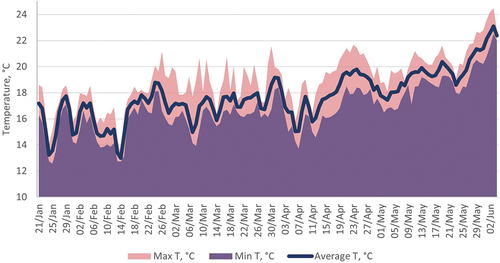
Figure 4. Cross-sectional views of the backscattering values from the selected peatland ROI (255 cm (l) × 100 cm (w) × 50 cm (d)) before the drought, constructed using a 10° incidence angle. The position of the trough is shown by the horizontal white line. The red dotted oval indicates an area with heather cover and hence increased volume scattering in cross-polarization (calculated as mean of HV and VH) can be seen.
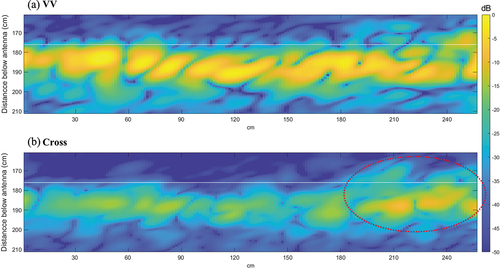
Figure 5. Time series of radar backscattering (a) and phase (b) measurements reconstructed using VV, HH, and cross-polarization and 10° incidence angle. Each backscatter datum is the result of an incoherent summation of pixels across the selected ROI (255 cm (l) × 1 m (w) × 50 cm (d)), extracted for each image in the time series. The red dashed lines indicate the beginning (21/01/2021) and end (17/05/2021) of the simulated drought period.
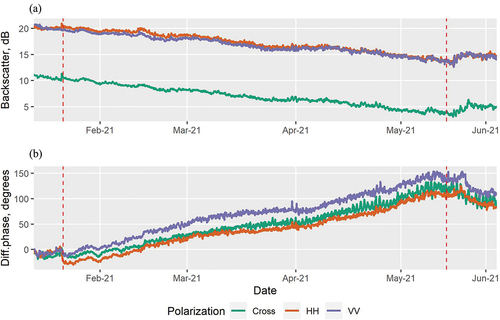
Figure 6. Correlation analysis between water level and radar backscatter (Figure 5a) and differential phase (Figure 5b) during the drought period (95 days with WL reaching 22 cm below the surface).
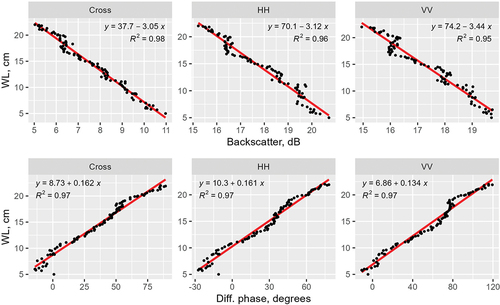
Figure 7. Soil moisture and backscattering strength response to drought (117 days of drought). Drying curves of the 6 soil moisture probes at 3–22 cm depth.
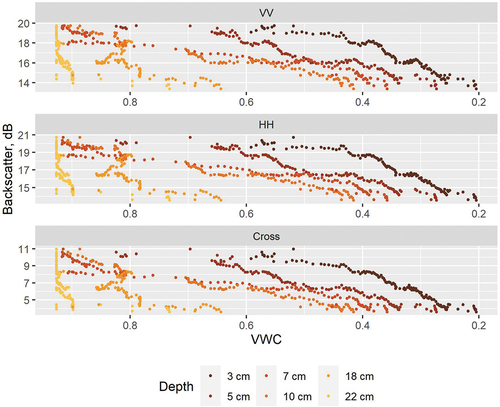
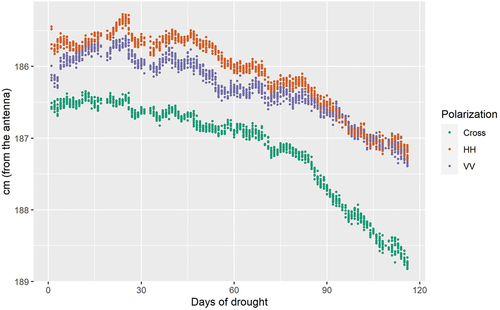
Figure 8. ROI backscatter weighted mean height change throughout the 117-day drought period.
Appendix_A_Supplementary_data.docx
Download MS Word (203.3 KB)Data availability statement
The data that support the findings of this study are available from the corresponding author upon reasonable request.