
Figures & data
Table 1. Characteristics of sensors used in this analysis. ‘Spatial resolution’ contains the value used in this analysis (some sensors have a range of spatial resolutions).
Figure 1. Study area map showing major rivers, stream gauge and land subject to inundation.
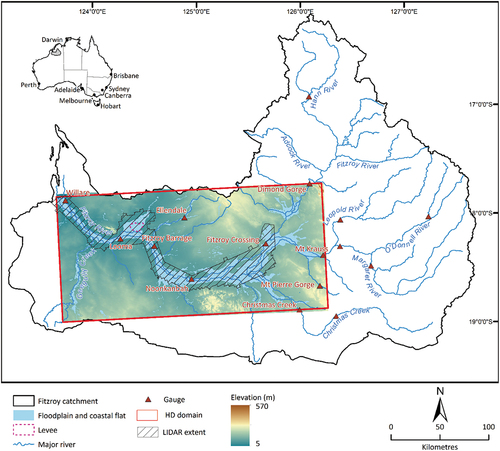
Table 2. Characteristics of the recent flood events in the Fitzroy floodplain (ARI = annual recurrence interval).
Table 3. Number of scenes available from each sensor for each flood event.
Figure 2. Spatial comparison of Landsat (LS), MODIS (MD), Sentinel-1 (S1), NovaSAR-1 (N1), Sentinel-2 (S2) and VIIRS (VI) with the hydrodynamic (HD) model water extent for different flood dates (F1 score is shown in brackets next to date, RS = remote sensing data).
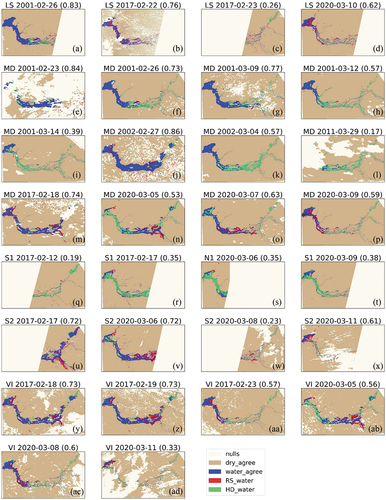
Table 4. Summary results for remote sensing data compared to hydrodynamic model.
Figure 3. Spatial comparison of proportion of agreement (‘HD water, RS water’) and disagreement (‘HD water, RS dry’ and ‘RS water, HD dry’) for Landsat, MODIS, SAR (Sentinel-1 and NovaSAR-1), Sentinel-2 and VIIRS with the hydrodynamic model (HD) water extent as calculated from all common flood dates (RS = remote sensing data). The red dots show the location of Fitzroy Barrage (Figure 3g) and the junction of Fitzroy River and Christmas Creek (Figure 3l and Figure 3o).
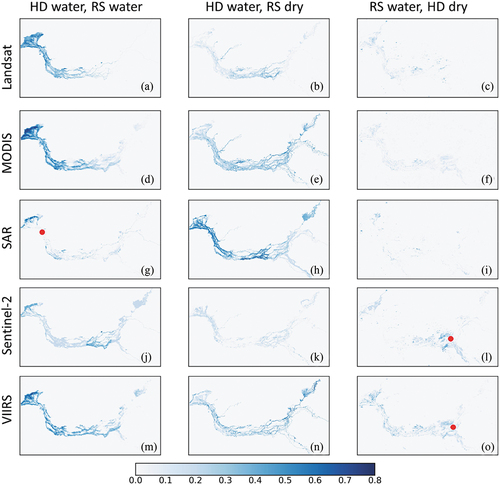
Table 5. Summary results for remote sensing data compared to the hydrodynamic model for the dates close to flood peak (i.e. ±80% of flood peak).
Figure 4. Spatial comparison of Landsat (LS), Sentinel-2 (S2), VIIRS (VI), Sentinel-1 (S1) and NovaSAR-1 (N1) with MODIS water extent for common flood dates (F1 score is shown in brackets next to date, RS = remote sensing data being compared to MODIS).
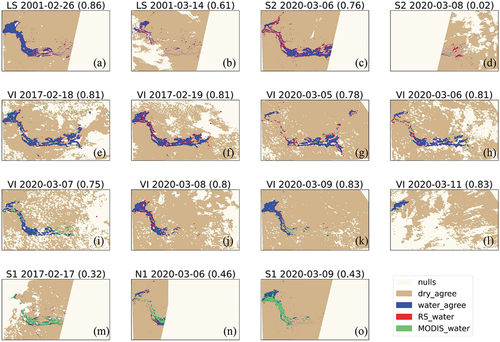
Figure 5. (a) Spatial comparison of Sentinel-2 and NovaSAR-1 water extent for 6th March 2020. (b) Sentinel-2 image (RGB = Red, Green, SWIR-2 bands), (c) NovaSAR-1 water map, and (d) NovaSAR-1 VV image for subset area (black square).
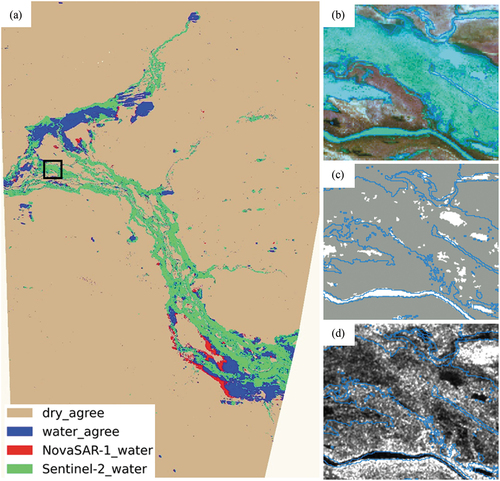
Table 6. Summary results for remote sensing data compared to other coincident remote sensing data.
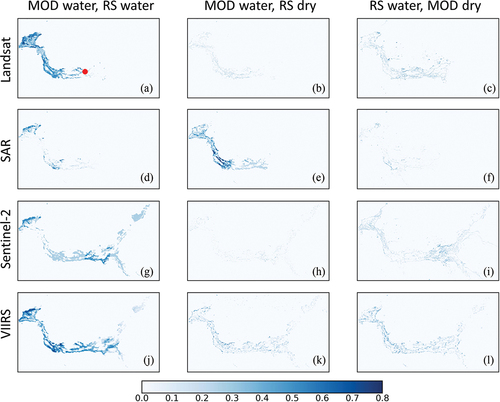
Figure 6. Spatial comparison of proportion of agreement (‘MOD water, RS water’) and disagreement (‘MOD water, RS dry’ and ‘RS water, MOD dry’) for Landsat, SAR (Sentinel-1 and NovaSAR-1), Sentinel-2 and VIIRS with the MODIS water extent as calculated from all common flood dates (RS = all remote sensing data except MODIS – which it is being compared to). The red dot shows the location of Noonkanbah in Figure 6a.
Data availability statement
The data that support the findings of this study are available from the corresponding author, CT, upon reasonable request.