Figures & data
Figure 1. Study area of the Somalian Puntland coast with the 175 km area of interest highlighted in red.
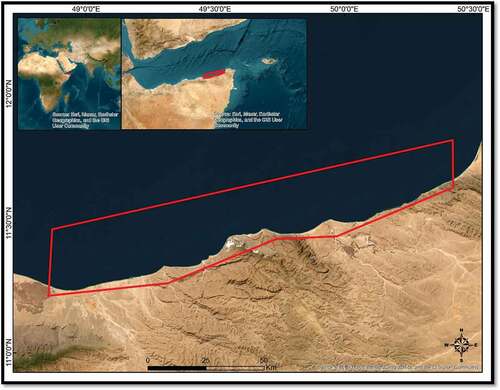
Figure 2. A band ratio equation applied to bands with low TDI (left) clearly reveals vertical striping throughout the image over aquatic pixels that are not seen in the terrestrial pixels (i.e. the lower right of the image). Using high-TDI bands (right) largely eliminates the striping.
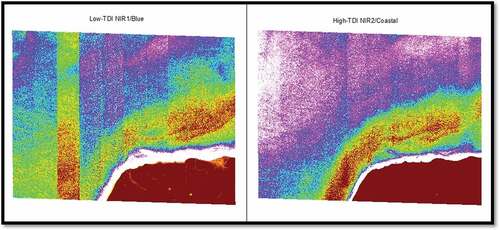
Figure 3. (Left) digital surface Model using 30 m SRTM data. (Right) digital surface Model derived from 2-view epipolar satellite imagery. Note the detail as the DSM is very near the GSD of the input satellite imagery (approximately 1.5 m postings).
Figure 4. Mapped vessels as purple objects with insets indicating a large congregation outside the port of Bosaso and a small congregation near a dried riverbed mouth.
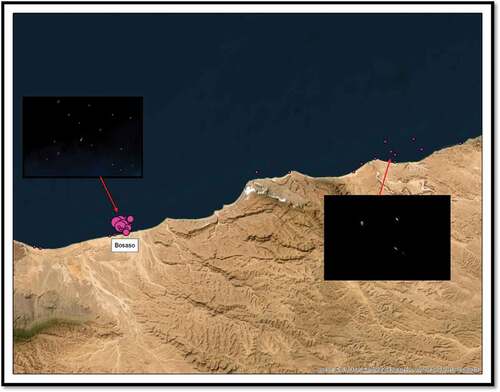
Figure 5. For a large congregation of vessels identified outside the port of Bosaso, the top panel shows the vessels as seen in WorldView imagery, and the bottom panel shows the mapped vessel objects classified by size (© 2020 DigitalGlobe NextViewLicense).
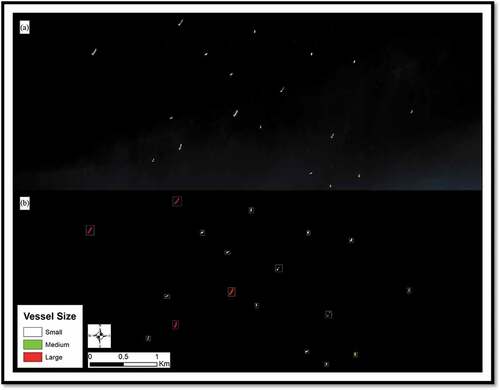
Figure 6. A subset of the Bosaso congregation zoomed-in for greater detail with validation boxes drawn around four vessels. Large vessels (red) are commercial cargo vessels and small vessels (white) are likely Iranian-style dhows (© 2020 DigitalGlobe NextViewLicense).
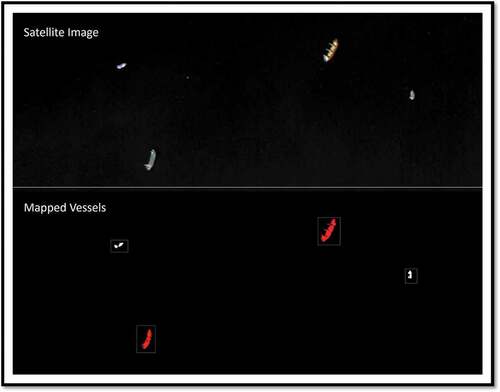
Table 1. Number of identified vessels per size class.
Figure 7. Bathymetry mapped across the study area with inset indicating a narrow region of deeper water (yellow and teal) close to shore.
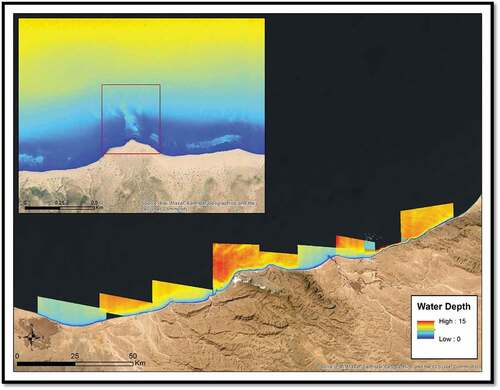
Figure 8. Elevation (left) from DSMs was used to create maps of slope (right) to identify areas of low relief (blue shades) that could facilitate overland transportation. The coastline tended to exhibit either very flat terrain or steep-sided cliffs. Dried riverbeds are apparent and may be used as convenient informal transportation routes.
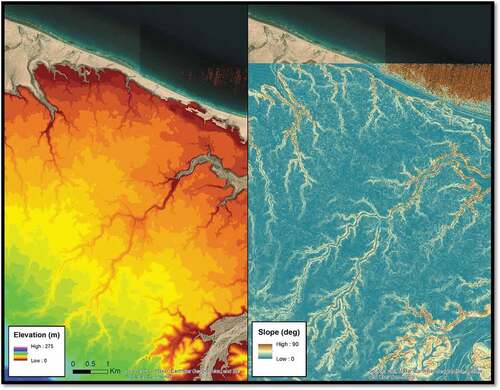
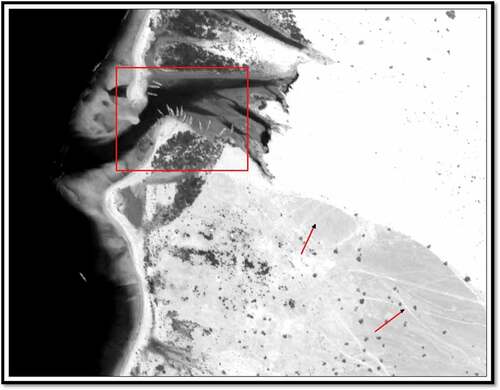
Figure 9. Example of identified vessel-beaching and overland transportation departure point. Small vessels are highlighted in the red box where an inlet facilitates safe vessel storage, and arrows point to apparent foot and vessel-traffic paths in the sand (© 2020 DigitalGlobe NextViewLicense).