
Figures & data
Fig. 1. Geographical distribution of The North-west European Sand Belt and location of the research area of The Veluwe within this belt.
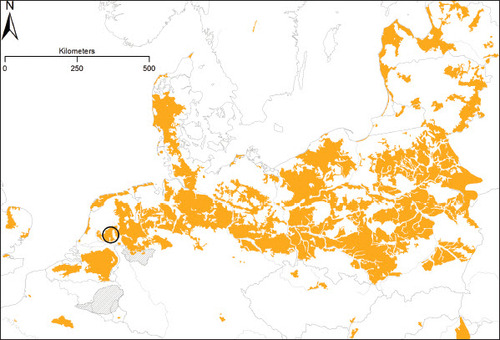
Fig. 2. Visualisation with airborne laser scanning data of historical cart tracks east of Oud-Reemst (Hoge Veluwe National Park, The Netherlands), visualization .In red, the outline of trial trench in the bundle of car tracks. Also indicated with the white arrow.
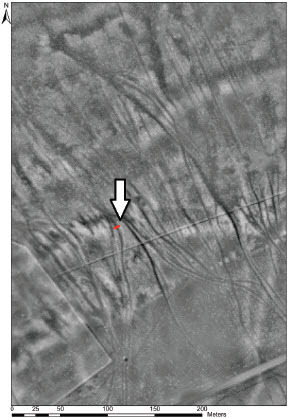
Fig. 3. Section of the archaeological landscape map of the Netherlands (1:50,000) depicting the Veluwe region and the trajectory of the medieval trade route of the Harderwijkerweg. Clearly visible are the characterising ice-pushed moraines in this area (light and dark orange sections). For a detailed description of the individual landscape units, legend and background information see Rensink et al. (2017).
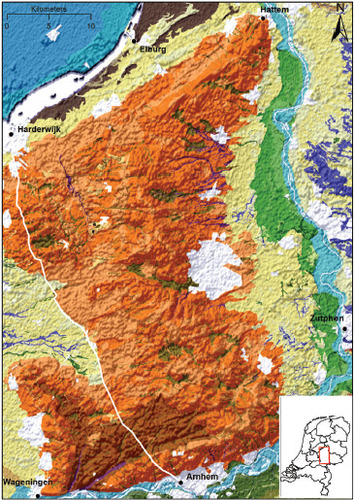
Fig. 4. The historical map of the Veluwe Quarter by Christiaan sGrooten from the year 1570 shows a large part of the Harderwijkerweg. Only in the northern part did the map differ from later maps.
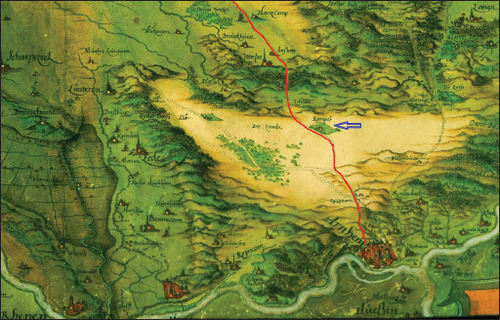
Plate I. In the seventeenth century the trade route network of the so-called Hessenwegen (Hessian roads) was constructed. It functioned independently from the medieval village road systems and therefore mainly passed uninhabitated heathland and forest areas.
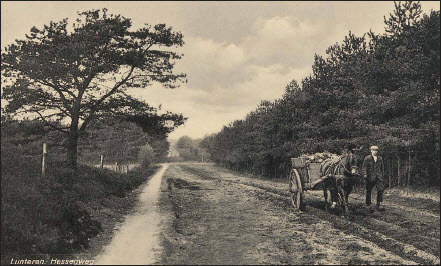
Plate II. Straight seventeenth-century hunting road of King William III at the Hoge Veluwe National Park.
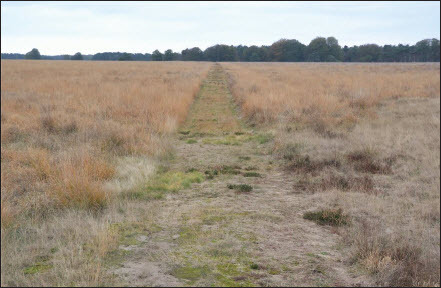
Fig. 5. Topographical map of 1900 of the hamlet of Oud-Reemst. The small farms (red) are surrounded by arable fields (white), woodlands (dark green), heathlands (pink) and sand blowings (grey).
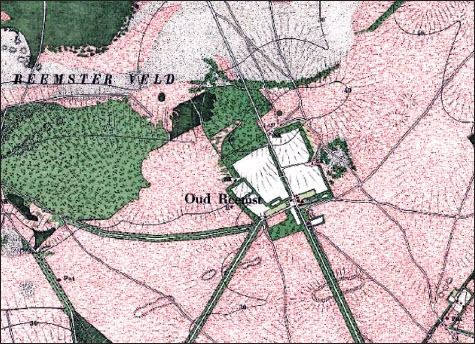
Fig. 6. Reconstruction of historic road systems of the Veluwe region by Airborne Laser Scan visualisation.
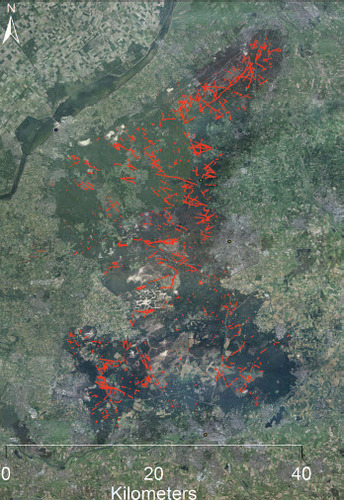
Fig. 7. Detailed maps of Willem Leenen from 1755 (central above), Barend Elshoff from 1725 (lower right) and Geelkercken van (lower left). The high and low road to Harderwijk are clearly depicted on first two the maps.
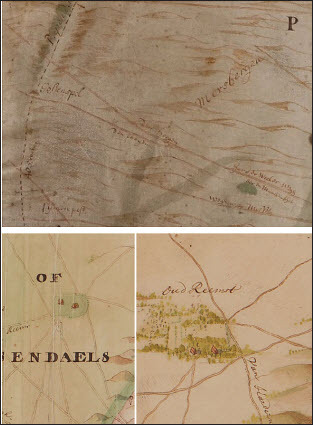
Plate III. Photo of old port of Harderwijk with carts and wagons.
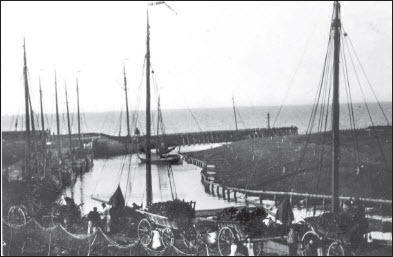
Plate IV. An overview image, the archaeological drawing and an image of a partial 3D model of the trial trench. The red and yellow dots represent the places of the OLS samples. The yellow ones, from left to right, number 26, 28, 30 and 32 in the drawing, are dated. The green lines are of orientation support for the viewer.
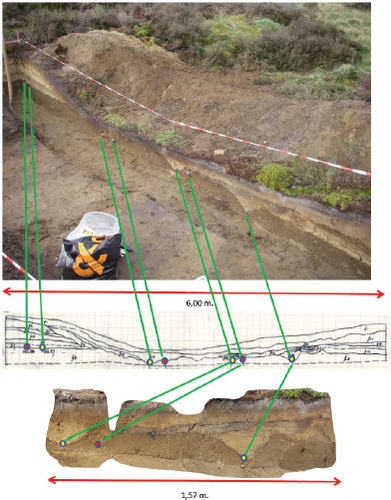
Plate V. A close up of the four dated OLS samples.
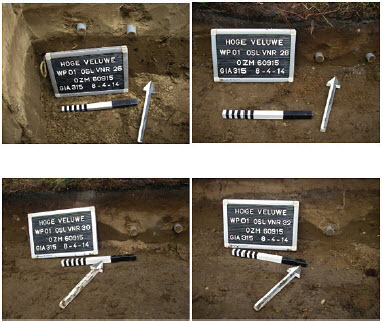
Table 1. Ols dating results.